Ethereum price has been trying to secure small gains over the last 24 hours. In the past week, the king altcoin brought home gains which were close to 6%.
At the current moment, however, the coin was mostly moving laterally.
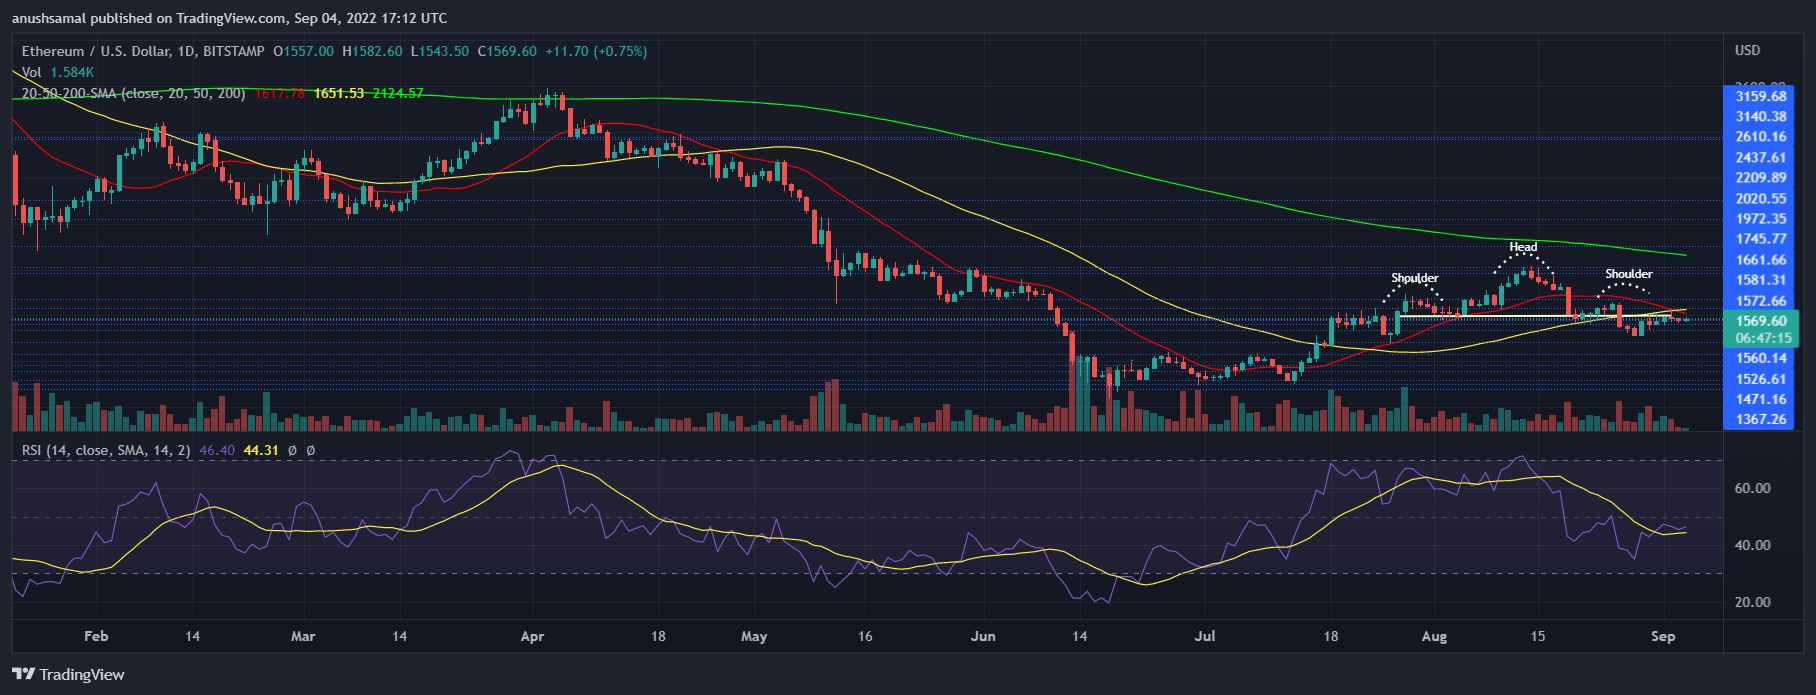
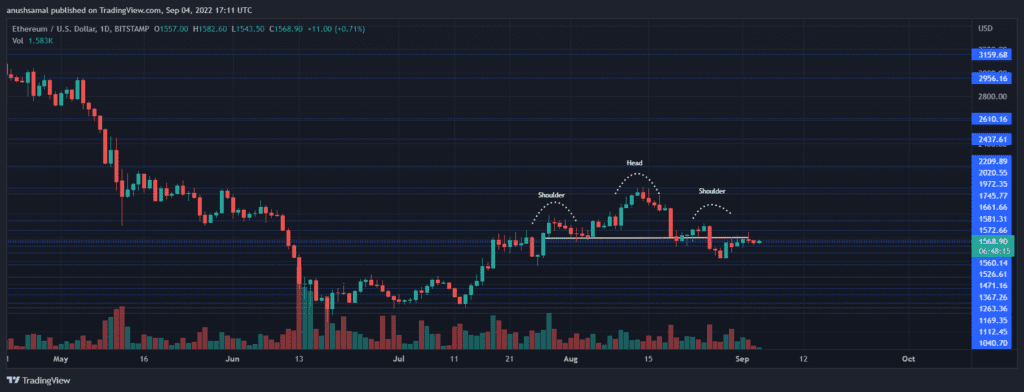
Ethereum price had also broken below its head and shoulder pattern as seen in the chart below. This pattern is related to bearishness.
In accordance, the buyers were low in the market. The technical outlook also continued to look weak on the one-day chart.
Broader market weakness has caused many prominent altcoins to move down their respective charts.
Bitcoin price has also remained weak under the immediate resistance of $20,000.
For Ethereum to move north without too much hindrance buyers have to step up. A move above the $1,600 price level will cause invalidation of the current bearish thesis.
Ethereum Price Analysis: One-Day Chart
ETH was trading at $1,560 at the time of writing. After struggling considerably, the altcoin has attempted to move up slightly on its chart.
This upward movement could soon be stalled if Ethereum price doesn’t manage to trade above the $1,600 price level.
This current price movement is a momentary respite.
The bears will remain in control unless ETH moves and remains above the $1,600 price mark.
The nearest support line for Ethereum stood at $1,520 but a push from bears will not make ETH stop at that level.
The next stop for the altcoin would be at $1,470. The trading volume of ETH registered a relief as seen with the green signal bar which meant buyers increased in number slightly.
Technical Analysis

The altcoin had witnessed almost two months of positive buying strength. At press time, however, sellers outnumbered buyers in the market. The Relative Strength Index was below the zero-line, signifying that buyers were fewer in number.
The tiny uptick in the RSI corresponds with the recent spike in the trading volume of the asset.
Ethereum price was under the 20-SMA line and that is an indication of sellers driving the price momentum in the market.
If demand returns, there is the chance that Ethereum will travel above its 20-SMA line bringing relief to the price.

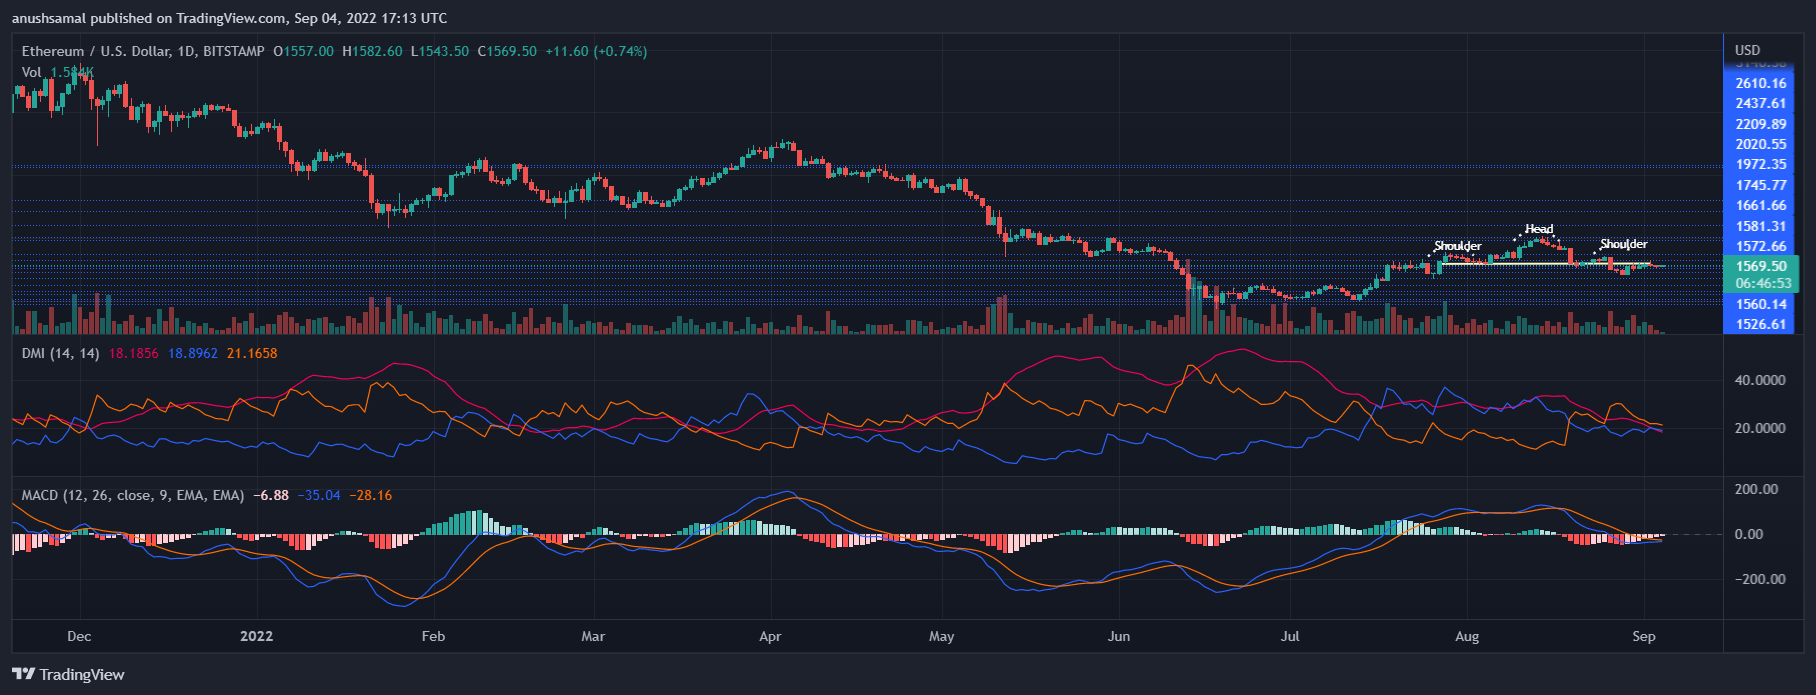
ETH’s other technical indicators sided with the bears at press time. Readings pointed towards continued bearish strength on the chart.
Moving Average Convergence Divergence reads the market momentum and it also predicts a change or reversal in the same.
MACD portrayed red histograms below the half-line after it went through a bearish crossover which is tied to sell signal.
Directional Movement Index reads the overall price movement of the coin and it also tells the strength of the current price movement.
DMI was negative as the -DI line was above the +DI line.
The Average Directional Index (red) was nearing 20, which is a sign of a weakening price trend.
Featured image from UnSplash, Charts from TradingView.com


