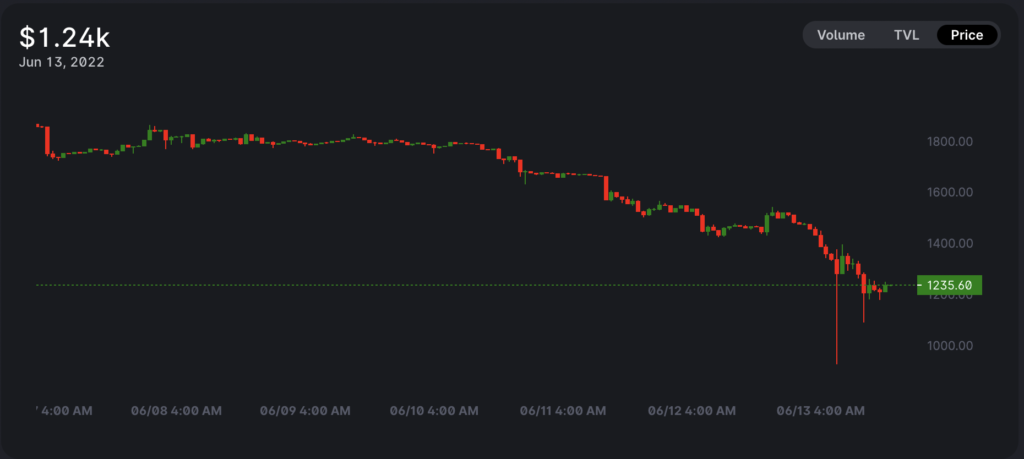
Ethereum’s native token Ether (ETH) fell to as low as $950 on Uniswap—a decentralized crypto exchange— this June 13, about 20% lower than its spot rate across other exchanges.
Over $130M ETH sold in six hours
The incident happened at around 03:00 UTC after a whale dumped 65,000 ETH for multiple “stablecoins,” including USD Coin (USDC), Tether (USDT) and Dai (DAI).
A piece of evidence noted that the whale sold its ETH holdings to pay off nearly $73 million worth of debt at Oasis.app, a DeFi lending platform. The duration of the sell-off saw ETH’s liquidation price dropping from $1,200 to $875.
not a liquidation, someone selling collateral to pay off debthttps://t.co/tceIla0xuF pic.twitter.com/KwIholu1St
— mariano.eth ✨ᕙ༼ຈل͜ຈ༽ᕗ✨ | (@nanexcool) June 13, 2022
The Oasis borrower continued the selling spree—dumping another stash of nearly 28,000 ETH five hours after the first selloff—to pay back another $32 million in debt. This time, the liquidation price rose from $892 to $1,200, as shown below.

As a result, the whale dumped around 93,000 ETH within just six hours. The amount equals to roughly $112 million at June 13’s ETH/USD price.
Interestingly, the Oasis borrower’s total outstanding debt was about $120 million (as measured in DAI stablecoin), suggesting that the whale suffered heavy “slippage” losses.
wtf… was this a misclick? https://t.co/POURtN4F6s
— Jonathan Howard (@staringispolite) June 13, 2022
Ether price eyes $667 — veteran analyst
Ether’s trip to $950 was brief, suggesting adequate demand for the tokens near the level. Nonetheless, one separate analysis from veteran trader Peter Brandt pointed at ETH’s price falling toward $650 in the coming weeks.
Brandt’s bearish outlook emerged out of a classic continuation pattern, dubbed the “descending triangle,” which resolves after the price breaks out in the direction of its previous trend.
Since Ether was falling before the triangle’s formation, its path of least resistance was skewed to the downside.

Brandt says that ETH had reached the triangle’s first downside target of $1,268 as the price declined 20% on June 13. He anticipates the declines to continue, with ETH dropping almost by another 50% to $667.
Nonetheless, Ether’s oversold relative strength index (RSI) could lead to a sharp price reversal. Ethereum picks additional rebound cues from its 200-week simple moving average (200-week SMA; the orange wave in the chart below) near $1,200, now serving as support.

If ETH price undergoes an upside retracement, then the token’s interim bull target could be near $1,450, coinciding with the 1.00 Fib line of the Fibonacci retracement graph drawn from around $1,450-swing high to the $84-swing low.
Related: Celsius exodus: $320M in crypto sent to FTX, user withdrawals paused
Conversely, a decisive close below the 200-week SMA could have ETH eye $920 as its next downside target.
The views and opinions expressed here are solely those of the author and do not necessarily reflect the views of Cointelegraph.com. Every investment and trading move involves risk, you should conduct your own research when making a decision.


