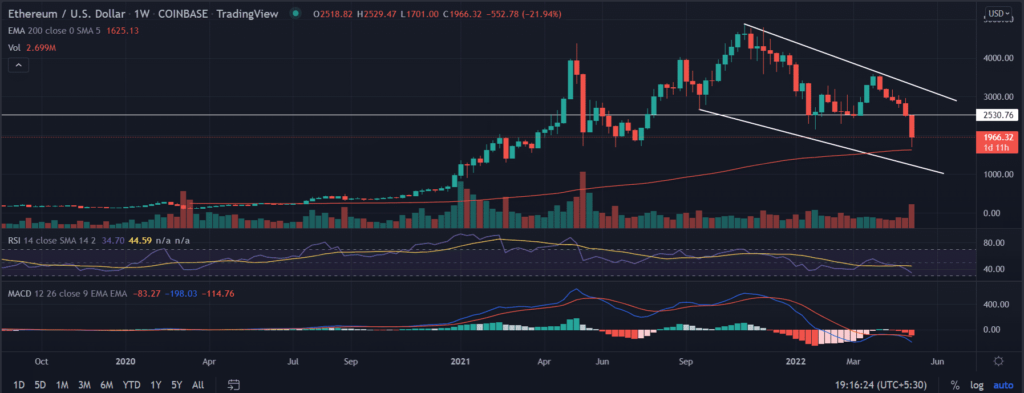
Ethereum price trades in a very tight range with no clear directional bias on Saturday, although bias remains negative. The ETH buyers struggle to sustain the gains at higher levels. However, the downside seems to be capped near $1,900, which makes it a vital support level in the current situation. The relief rally bought back the crypto above the $2,000 mark following the massive sell-off. Still, the downside pressure remained intact in the asset.
- ETH price looks pessimistic on all time-frame as it still trades below $2,000.
- The price managed to bounce back after testing a 10-month low on Thursday.
- However, the downward channel on the weekly chart suggests the crypto is not out of woods yet.
ETH price seeks sign for reversal
ETH price traded in a downward trend since November with a drop of 65% as it made record highs at $4,867.81. Since then, the price moved inside the downside parallel channel with the classic Lower low and lower high formation. Before breaking the long-term horizontal zone placed at around $2,500, the price tested it thrice, making it a crucial level to hold for investors.
The price broke the level this week and locked the loss of more than 20%. Further ETH approaches the critical 200-day EMA (Exponential Moving Average) at $1,625.13. This indicates the underlying bearish current in the asset.
However, as per the parallel channel formation, the price should bounce back toward $2,500. Again, an extended buying would force it to reclaim $2,900. Before turning negative once gain.
On the flip side, a spike in sell orders could drag the price lower to test $1,700.
Trending Stories
Technical indicators:
On the weekly chart, the relative strength index (RSI) fell below the average line on April 24. Another oscillator, the moving average convergence divergence holds into the oversold zone with negative bias.
As of publication time, ETH/USD reads at $1,967, down 1.91%% for the day.


