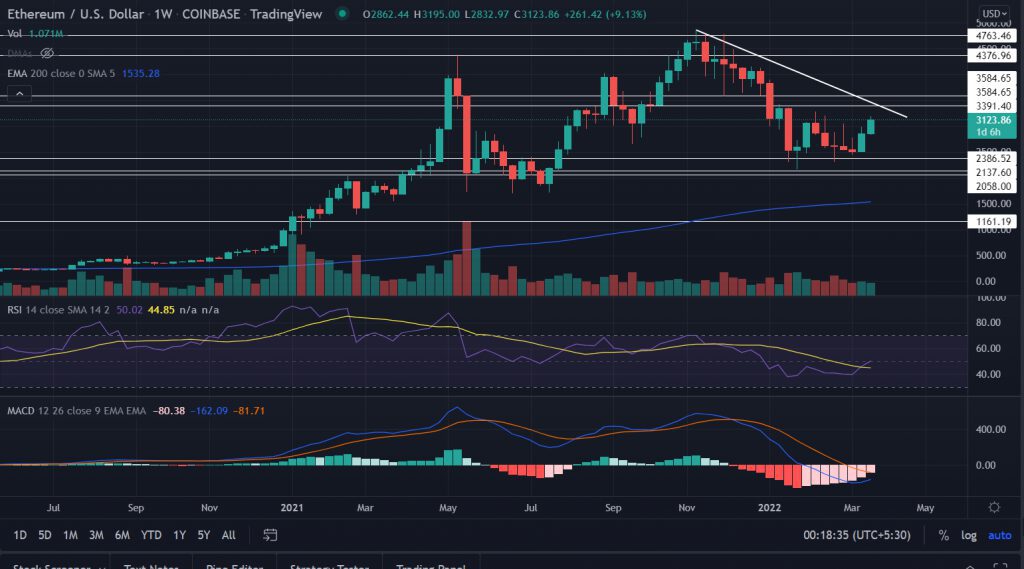
Ethereum price gained remarkable gains over the past two weeks. The price found stable support near $2,500 as it continued its uptrend from the level. However, the upside faces resistance near the descending trend line from the record highs of $4,867.81.
- Ethereum price consolidates with modest gains on Saturday.
- A weekly close above $3,284.75 will set the path for $4,000.
- ETH price gains 12% on weekly basis.
As of writing, ETH/USD trades at $3,118.22, up 0.46% for the day. The second-largest cryptocurrency by the market cap stands at $9,276,333,183 according to the CoinMarketCap.
ETH looks for upside continuation
On the weekly chart, the ETH price makes reliable support around the $2,150 level, which also forms a ‘double’ bottom formation. At first, the price tested the levels in July and tag the record levels at $,4867.81 in November. ETH price surged more than 100% during that period.
Currently, the price is hovering in a short-term trading range of $2,500 and $3,200 on the weekly time frame. A green candlestick for the third consecutive week will establish a setup for another leg up in the asset.
The first upside hurdle for the bulls is placed at $3,391.40. A weekly close above the mentioned level in combination with the break above the bearish line will bring the psychological $4,000 level into play.
Best optionsEarnEarn 20% APRClaim5 BTC + 200 Free SpinsWalletCold Wallet
The bearish slopping line, which is extending from the highs of $4,867.81 acts as a strong resistance barrier for the bulls. Thus making a crucial level to trade.
On the other hand, a weekly close below $2,800 will invalidate the bullish outlook for the asset.
Technical indicators:
RSI: The weekly Relative Strength Index rose above the average line on March 14 for the first time since July 2021.
MACD: The Moving Average Convergence Divergence attempted to move above the midline with a receding bearish momentum.


