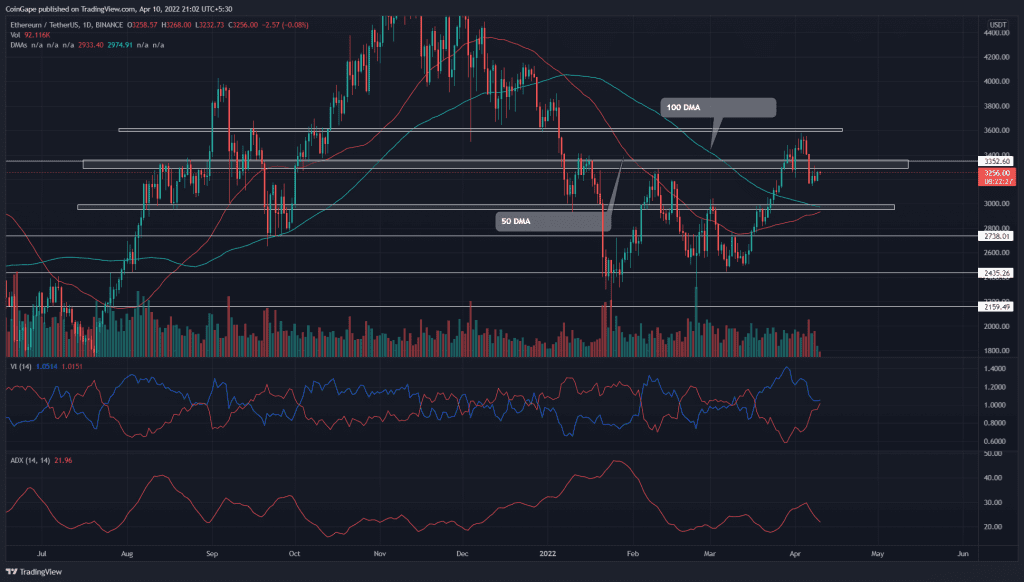
The shared resistance of $3580 and 200 DMA triggered a minor retracement in ETH/USDT pair. On April 6th, the sellers gave a strong breakdown from the $3300 support, suggesting further price correction to $3000. A bullish crossover between 50 and 100 DMA at $3000 support may provide dip opportunities to long traders.
Key points:
- The ETH price forms a bearish engulfing candle in the weekly time frame chart
- The 50 and 100 DMA are heading towards a bullish crossover
- The intraday trading volume in Ether is $1.64 Billion, indicating a 34% loss
Source- Tradingview
During the recent recovery rally, the ETH price outperformed Bitcoin through a 47% gain in the last three weeks. The bullish rally hit the $3457 resistance zone, its highest level since early January.
However, the sellers took advantage of the current volatility in the market and slumped the altcoin below the $3300 support. As a result, the ETH price tumbled by 10% since last week and is poised to provide a weekly closing below the breached support.
The weekend is spent to retest the $3300 flipped resistance and confirm a genuine breakdown. The 20 DMA would assist sellers in maintaining trend control and dumping the altcoin by another 8.5% to $3000 physiological support.
The interested buyers need to watch this level closely as a bullish crossover among the 50 and 100 DMA at the support zone($3000) may bolster an upside reversal.
- Resistance level: $3350 and $3600
- Support levels: $3000 and $2738
Technical Indicator
Vortex indicator– a bearish crossover between the VI+ and VI- slopes would provide additional confirmation for downfall.
The average directional index: Moreover, the declining ADX(22) slope hints that buyers are losing their grip on ETH price.


