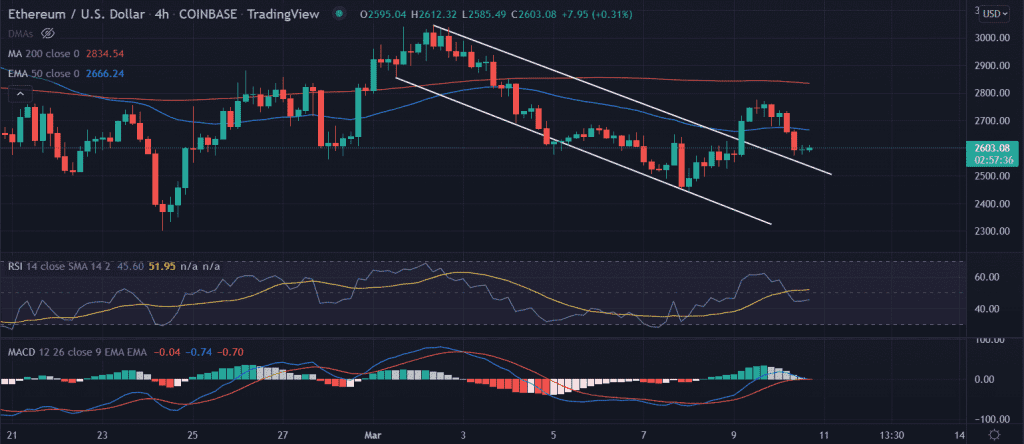
Ethereum price fails to sustain the previous session gains on Thursday. ETH begins with a slow start and retraced to the session’s low in the European session. Currently, the price is struggling around the critical $2,600 mark. It is interesting to watch if the price is able to sustain lower levels.
- Ethereum price wiped out all the previous session gains on Thursday.
- Extended sell-off in ETH if price closes below $2,500 on a daily basis.
- Bears remain in full control below 200-day and 50-day EMAs, despite recent price action.
As of writing, ETH/USD is trading at $2,606.23, down 4.43% for the day. The second-largest cryptocurrency by market cap holds 24-hour trading volume at $13,254,024,520 with a decline of more than 19%.
A receding volume along with declining price indicates sellers lack the conviction to extend the sell-off further. However, few technical formations negate the above arguments.
Ethereum price consolidates near $2,600
On the 4-hour chart, Ethereum’s price is consolidating near $2,600 indicating this is a crucial level to trade. A break below the session’s low could test the downside channel at $2,517.0.
Furthermore, a daily close inside the downside channel will further target $2,350.
On the flip side, a spike in buy orders or shift in buying sentiment could spur the upside momentum. A test of 50-EMA (Exponential Moving Average) at $2,666.50 will pave the way to once again tag the $2,800 psychological level.
Ethereum price is trading inside the downward channel from the highs of $3,045.00 since March 2. The price depreciated 20% till it made lows of $2,449.85. However, ETH made an attempt to pierce above the channel but retraced toward the upper trend line. Now, investors will be convinced of the breakout if $2,600 remains intact.
Technical indicators:
RSI: The daily Relative Strength Index trades at 46 below the average line.
MACD: The Moving Average Convergence Divergence reads just near the midline with a neutral bias.


