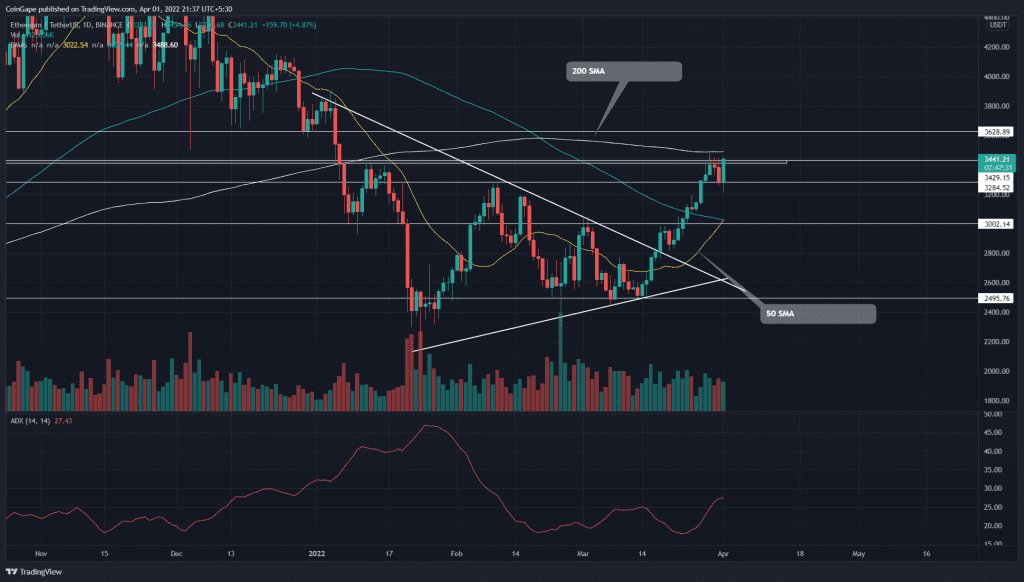
The recovery rally initiated on March 14th has pumped the ETH/USDT pair by 38.5% in around three weeks. Today(on April 1st), the Ether price is up by 5.5% and teases a bullish breakout from the $3430 resistance.
A candle closing above the overhead resistance will trigger another long opportunity with $3430 as the nearest target.
Key points:
- The ETH price forms a bullish engulfing candle at $3325 support
- The 50-and-100-days SMA is soon to give a bullish crossover.
- The intraday trading volume in Ether is $2.80 Billion, indicating a 98% gain.
Source- Tradingview
The asymmetrical triangle pattern breakout on march 18th accelerated the Ethereum(ETH) recovery rally. The post retest rally pumped the coin price by 21.1% as it breached some crucial resistance such as $3000, $3200, and 100-day EMA.
The bullish rally hit the $3400 resistance on March 28th, its highest since the second half of January However, after a minor pullback to $3250 immediate support, the ETH price rebounded with a long bullish candle and rechallenges the overhead resistance.
A bullish breakout from the $3430 would ascend the altcoin to $3628 resistance.
- Resistance level: $3400 and $3630
- Support levels: $3000 and $2773
Technical Indicator
The 200-day SMA stands along with the $3430 resistance providing an additional defense for short traders. Moreover, the 50-and-100-SMA lines are on the brink of bullish crossover.
The rising average directional movement index(22) slope climbed higher, indicating a bullish trending momentum.
On-chain metric-Global In/Out of the Money
Concerning the steady price recovery, the GIOM metrics show the number of ETH holders getting In The Money(83.92%) are rising, and similarly, the Out the Money(8.3%) holders are decreasing.
This indicates that the majority of coin holders are experiencing profit, and the possibility of them selling the coin is less, which bolsters the ongoing bullish rally.


