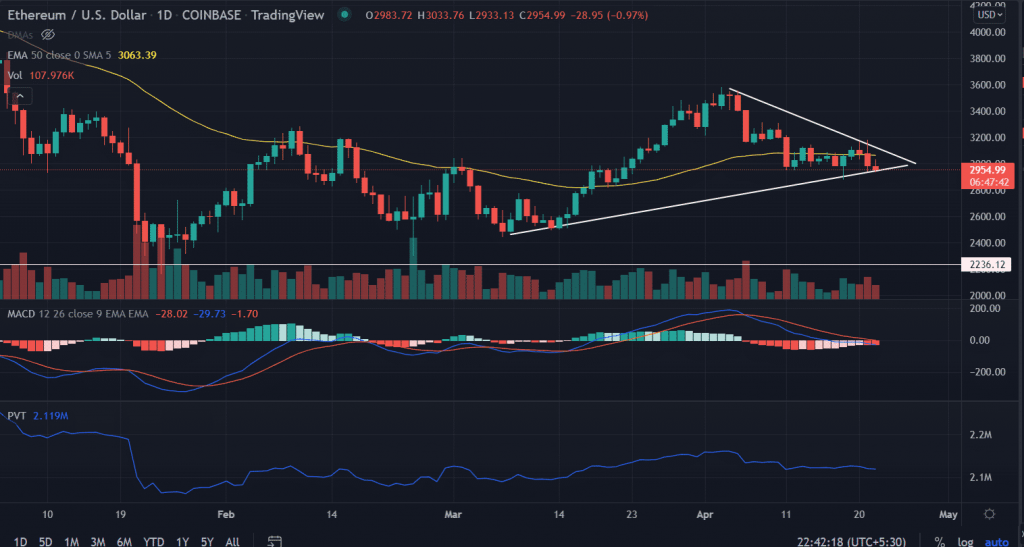
ETH price extends the losses as the U.S trading session begins. The price is struggling below the $3,000 mark for the previous two sessions. ETH now hovers near a vulnerable point, a breaking would trigger more downside in the pair.
- ETH price continues to consolidate below $3,000 for the past two sessions.
- Expect more downside if the price breaks below the ascending trend line on the daily chart.
- However, a daily candlestick above $3,000 would invalidate the bullish outlook.
As of publication time, ETH/USD reads at $2,933.13, down 0.93% for the day.
ETH looks for a bearish catalyst
On the daily chart, the ETH price dropped 35% from the swing highs of $3,548.51. The formation of a Doji candlestick followed by a strong red candlestick led to a fall in the asset. However, the price is harboring a strong support level of around $2,950 since April 11 making it a crucial level to hold for the bulls.
In addition to that, the formation of the ‘Symmetrical triangle’ indicates the price approached near the converging trend lines. The increased selling pressure could result in the lower breakout of the triangle with eyes on $2,750.
On the other hand, if the price is able to close above the session’s highs it would make bulls hopeful of a quick recovery to toward $3,100. This will also mark the piercing of the 50-day ema and break of the symmetrical triangle.
Trending Stories
Investors shall collect the buy-side liquidity toward the horizontal resistance level at $3,400.
The second-largest cryptocurrency holds the 24-hour trading volume at $19,789,392,413 as updated by the CoinMarketCap.
Technical indicators:
MACD: The moving average convergence divergence slips below the midline with advancing bearish momentum.
PVT: The price-volume trend suggests declining volumes in correspondence to the price.


