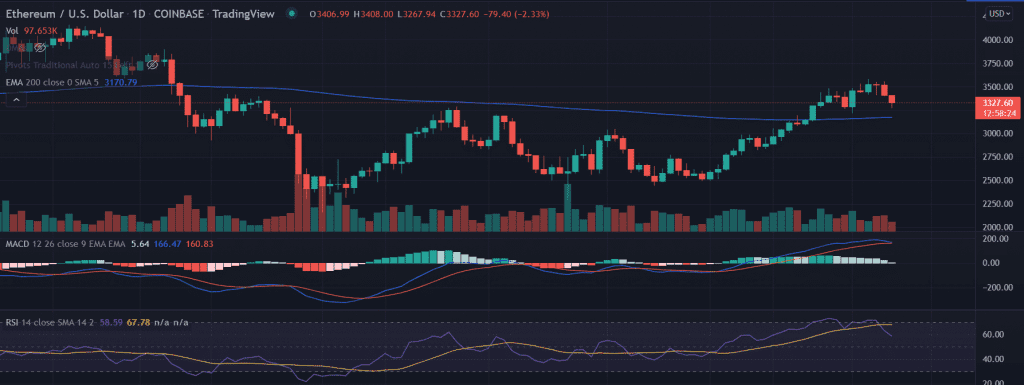
ETH price fell for the third session in a row. The price recovered from the lows and manages to trade above $3,300. Further, if the price holds above the critical 200-day EMA, it could be a hint for the next Bull Run.
- ETH price trades lower with modest losses.
- A retracement toward the 200-day EMA could be a stepping stone for the next run-up.
- The momentum oscillators turn neutral warning of aggressive bids.
As of press time, ETH/USD is trading at $3,341, down 1.92% for the day. The second-largest cryptocurrency is holding the 24-hour trading volume at $22,050,910,385 as per the CoinMarketCap.
ETH price trades downside
On the daily chart, the ETH price retraced from the swing highs of $3,581.60 made on April 3. Since then the price witnessed a descent of 9%. Currently, ETH trades near the critical resistance-turned-support level at around $3,300.
Now, a sustained bearish pressure will result in a pullback of the prices. Traders could find immediate support near the 200-day EMA (Exponential Moving Average) at $3,170.
advertisement
The selling could intensify toward the horizontal support level at $3,000 if the price breaks the mentioned support level.
On the contrary, a spike in buy orders would reverse the prevailing trend in the asset. In that case, the ETH price keeps eye on the recent highs near $3,550.
An acceptance above $3,550 would set the ground for the next leg up in ETH.
Technical indicators:
RSI: The daily Relative Strength fell below the average line on April 4. Currently, it reads at 59. Any downtick in the indicator would strengthen the bearish outlook.
MACD: The Moving Average Convergence Divergence holds above the midline but with receding bullish momentum.
Trading volumes: The volume oscillator hovers toward the oversold zone.


