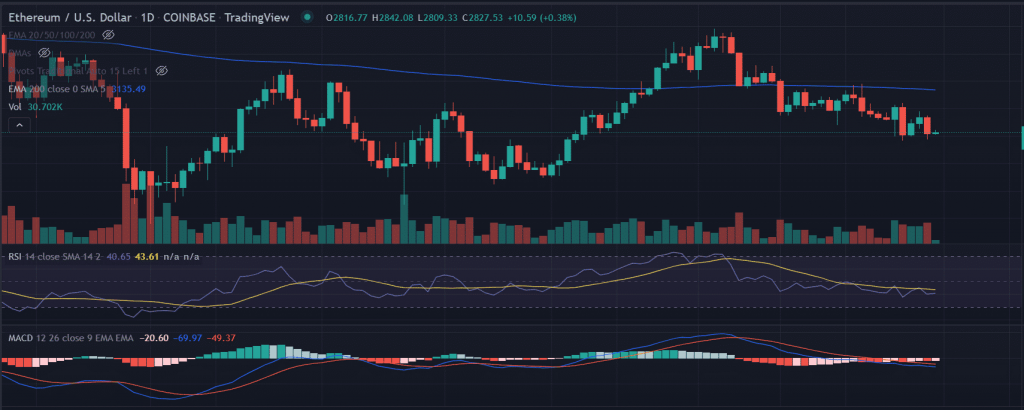
ETH price started the session on a lower note after witnessing a sell-off in the previous session. The price consolidated in a very tight range with no meaningful price action. ETH price dropped below a significant level that indicates the buyers are still not out of woods. The recent price action suggests ETH slipped below the $3,000 and $2,900 demand zone flipping it into a bearish breaker. The downward is imminent in the entire crypto space, a bounce-back in the largest cryptocurrency could mirror the move in ETH.
- ETH price exhibits a very range-bound movement with no clear directional bias.
- Expect an ascent of 14% as the price forms a bottoming pattern on the daily chart.
- A daily candlestick below $2,600 would invalidate the bullish arguments in the pair.
ETH price trades sideways
On the daily chart, the ETH price has formed a strong base foundation around $2,400 extending from January 24 to February 23. Since February 24, the price surged nearly 45% to test the swing highs at around $3,581.60. However, the bulls lack the conviction to carry forward the gains and retreated to test the lows near $2,770.
We expect a resurgence in the buying pressure from the reliable support zone could push the price higher. In doing so, the first challenge would be the critical 200-day EMA at $3,135.50 followed by the highs of April 6 at $3,408.
On the contrary, if the price failed to sustain the session’s low it would trigger a key level to initiate a fresh round of selling. The sellers would drag the price to the lows of March 16 at $2,604.32.
As of press time, ETH/USD is trading at $2,827.20, up 0.36% for the day.
Trending Stories
Technical indicators:
RSI: The Relative Strength Index (RSI) is hovering below the average line since April 5. Still, there is no sign of immediate reversal.
MACD: The Moving Average Convergence Divergence oscillates below the neutral line with receding bearish momentum.


