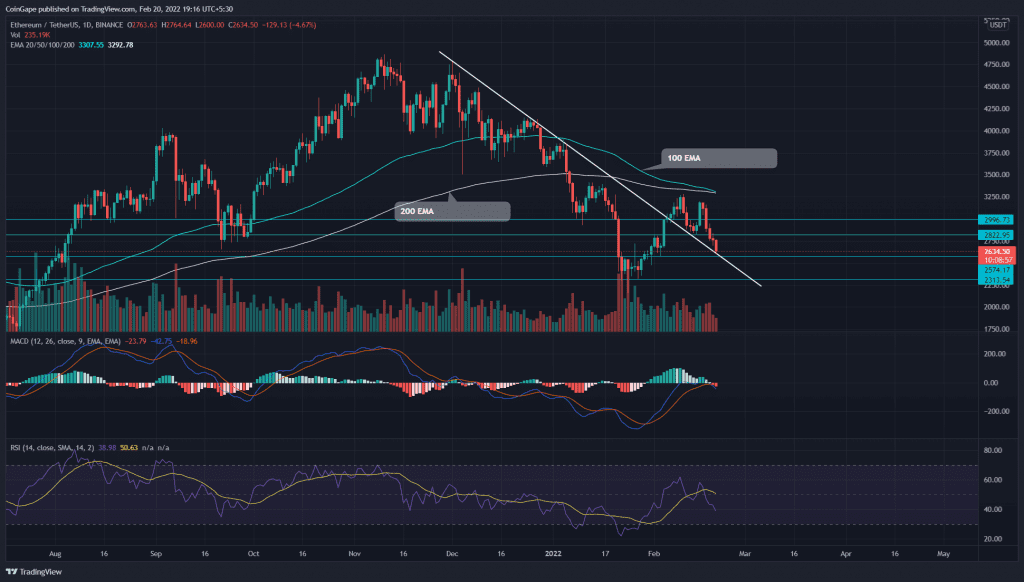
Following a minor pullback to retest the breached resistance trendline, Ethereum (ETH) price lost 15% from $3300. However, the ongoing sell-off in the crypto market bolstered the sellers to pull the pair below the $2820 support, suggesting the sell-on-rally sentiment remains intact. Can buyers sustain the $2550 support or sellers will extend the down rally?
Key technical points:
- The MACD indicators to reenter the negative region
- The ETH price registers a18% loss in the last four days
- The intraday trading volume in ETH/USD is $11.1 Billion, indicating a 27% fall.
Source- Tradingview
During late January, the Ethereum (ETH) price bounced back from the $2313 support, resulting in a 42% recovery rally. The sustained buying allowed buyers to breach a prolonged descending trendline and reached $3281 on February 10th.
The altcoin turned down from this level and was expected to retest the poked trendline. However, the buyers couldn’t follow up the recovery and in contrast, lost the $2800 support following a double top pattern fallout.
Amid the recent recovery, the MACD indicator lines were about to reach the bullish territory. However, the ongoing sell-off has triggered a bearish crossover, indicating a sell signal.
The daily-Relative Strength index(49) slope sinks below the equilibrium, indicating a bearish sentiment.
100 And 200-day EMA Suggest More Pain For ETH Holders

Source-Tradingview
The Ethereum (ETH) is steadily approaching the shares support of $2575 and descending trendline. If buyers defend this level and revert the altcoin higher, the crypto trades can expect another rally to the $3300 mark.
However, if sellers smash this near support, the coin price would tumble another 10% in reaching the $2300 mark.
The down-sloping 20, 50, and 100-day EMA signals the bears are in command. Moreover, the 100 and 200 EMA on the verge of negative crossover would encourage further meltdown.
- Resistance levels- $3300, $3400
- Support levels are- $2575 and $2300


