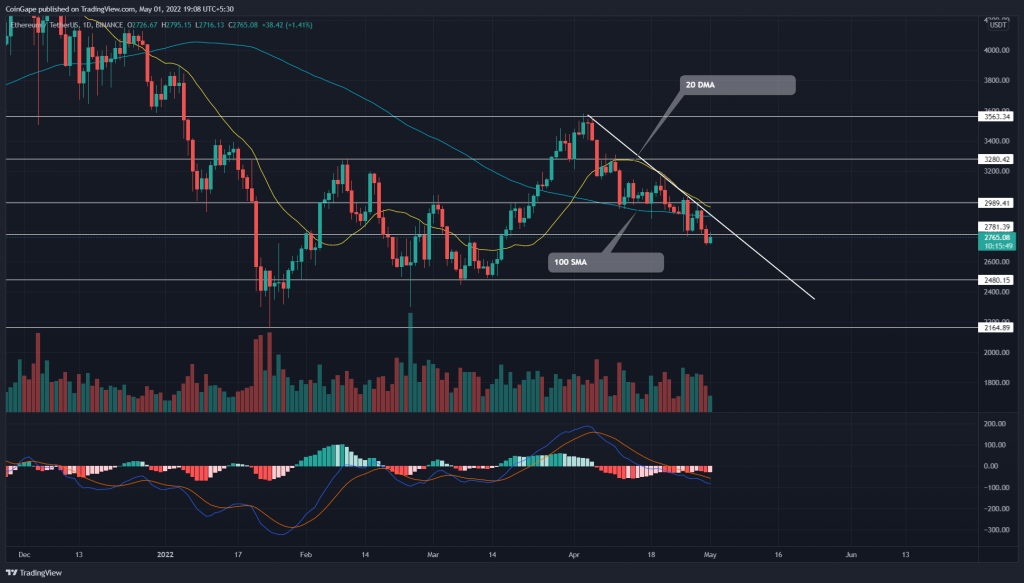
The sustained selling in Ethereum(ETH) price has knocked out several horizontal levels and DMAs. The altcoin recently breached the $2800 suggesting the sellers are prepared for another leg down. Moreover, the sellers could extend the correction rally to $2500 under the descending trendline influence.
Key points from ETH analysis:
- The 20 and 100 DMAs are nearing a bearish crossover
- A descending trendline carrying the ongoing correction phase
- The intraday trading volume in Ether is $15.2 Billion, indicating a 2.2% hike
Source- Tradingview
On April 5th, the Ethereum(ETH) price turned down from the $3600 resistance with an evening star candle. With Bitcoin losing $40000 support, altcoin faced the same fate and displayed a V-top reversal.
The sustained selling has breached three significant support levels such as $3200, $3000, and now recently the, $2800. However, today the ETH price is up by 1.24% and is trying to retest the breached resistance.
The ETH price will descend 11.6% towards the $2500 support if the selling momentum persists. Moreover, the technical chart shows a highly influential descending trendline which provides constant resistance to coin price.
Trending Stories
This descending trendline assists traders in selling the rallies, which could bolster a freefall to $2500.
advertisement
Alternatively, a bullish breakout from the resistance trendline would suggest the end of this minor correction and may trigger a new recovery rally. The potential rally may bring the ETH price $3000 resistance.
Technical Indicator
DMA: Aligned with the descending trendline, the 20 DMA offers dynamic resistance in leading this ongoing correction. Moreover, the coin chart hints at a potential crossover between the 20 and 100 DMA, which would attract more selling into the market.
MACD Indicator: The downsloping fast and slow line maintaining a sufficient distance between them accentuates sustained selling from the traders.
- Resistance level: $2800 and $3000
- Support levels: $2480 and $2200


