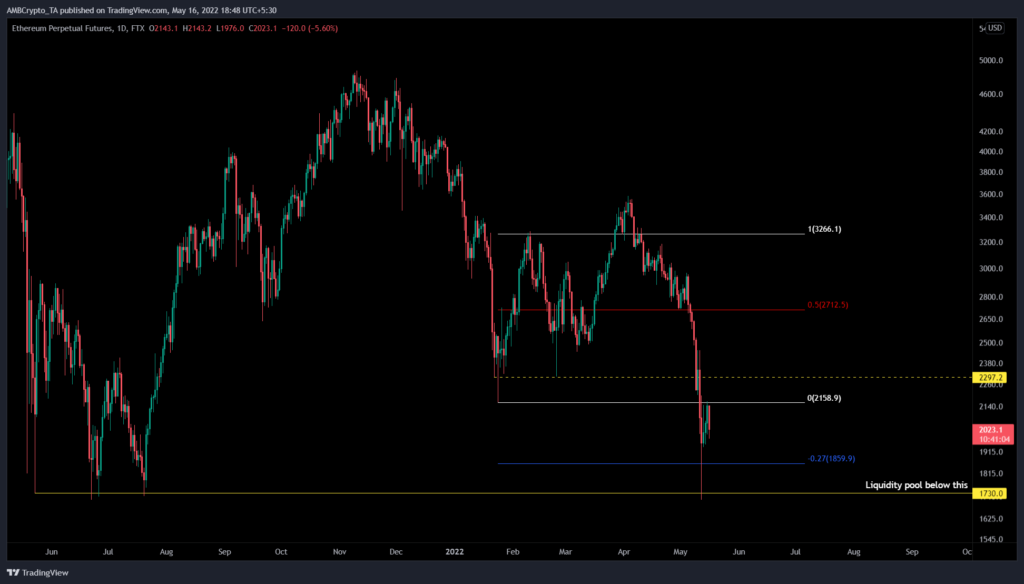
The recent bear market has had an unforgiving effect on altcoins across the market. ETH buyers showed strong conviction during the recent downswing. However, as things worsened, significant support levels were breached and the recovery does not seem to be going well.
Ethereum price in a dilemma
Ethereum’s price set a range extending from $2,158 to $3,266 after crashing 33% between 18 to 24 January. The initial downswing was met by many investors who rushed to buy the dips, leading to a 51% upswing in the under two weeks.
This move pushed beyond the range high and set a swing high at $3,266. However, the buyers failed to sustain, leading to a quick dip. This development provided an easy confirmation that the rangebound moves are in play.
As mentioned in prior articles, in rangebound setups, a sweep of one of the limits is often followed by a reversal that eventually sweeps the other limit. After a 51% run-up, massive profit-taking leads to a pullback under the 50% retracement level at $2,712, and eventually, the LUNA-UST crash pushed ETH below $1,730 briefly.
The downswing shattered the range low at $2,158 and the -0.27 retracement level at $1,859. However, the recovery has put ETH between these two barriers. Bitcoin, on the other hand, has shown a strong recovery above significant hurdles. Therefore, the price could be due to more pain in the near future.
A recovery above $2,158 could send it back to $2,712, but a failure could crash Ethereum’s price below $1,730.
Supporting this uncertain future for ETH is the 30-day Market Value to Realized Value (MVRV) model. This indicator is primarily used to gauge the sentiment of holders as it tracks the average profit/loss of investors who purchased ETH tokens over the past month.
Generally, a negative value indicates that these holders are underwater and a positive value indicates that holders are in profit. The probability of a sell-off is high in the latter condition.
Based on Santiment’s backtests, a value between -10% to -15% indicates that short-term holders are at a loss and long-term holders tend to accumulate under these conditions. Therefore, the aforementioned range is termed an ‘opportunity zone,’ since the risk of a sell-off is less.
As mentioned in the previous articles, the 30-day MVRV showed two support floors at -15% and -30%. While the crash pushed the MVRV close to the second barrier, it failed to retest it. Currently, the indicator is hovering around -15%, suggesting that a further crash in ETH price could be a possibility.


