Bitcoin (BTC) accumulation is seeing a massive surge as it rises to levels last seen in 2015. This bullish metric follows Bitcoin’s crash from the $20k support as the bears look to take charge of the markets.
BTC accumulation trend sees levels last witnessed in 2015
Ki Young Ju, CEO of crypto analytics platform CryptoQuant, shared the update on Twitter Monday, as he introduced a chart to confirm his analysis. Ki’s analysis stemmed from Bitcoin’s Realized Cap – UTXO Age Bands indicator. Per data from the chart, BTC held for over six months now contributes a whopping 74% of the asset’s realized cap.
The last time the community witnessed this metric was in 2015, during the market bottom below a BTC value of $220. The surge in realized cap contribution ratio for BTC aged 6 to 12 months had been recorded twice since 2015 before this recent rise.
Interestingly enough, each surge coincided with the market bottom. The increase to 77% in 2015 occurred during the cycle bottom. Additionally, during the depths of 2019, realized cap contribution ratio for BTC aged 6 to 12 months saw another rise to 70%.
Several market watchers have called the bottom of this cycle despite a few others asserting that the markets could still see further dips before a major bull run. This metric conforms with the assertion of a cycle bottom, especially as BTC failed to retest mid-June’s lows.
 
 
BTC supply on exchanges dips to a 4-year low of 8.98%
Additionally, it indicates how strong the will of most BTC holders is, regardless of the inauspicious market weather, as investors are willing to keep their BTC unmoved for over six months. Ki pointed out the difficulty involved in this practice especially considering market realities.
Furthermore, Santiment recently highlighted another bullish signal from an exchange indicator. Data suggests that investors are taking their BTC off exchanges, as the supply ratio of BTC on exchanges falls to 8.98% for the first time since 2018.
With the ratio of BTC supply on exchanges seeing a dip, confidence is pumped into the space as selloff risks get reduced. Generally, investors take their assets off exchanges to personal wallets when they intend to hold them for a long time.

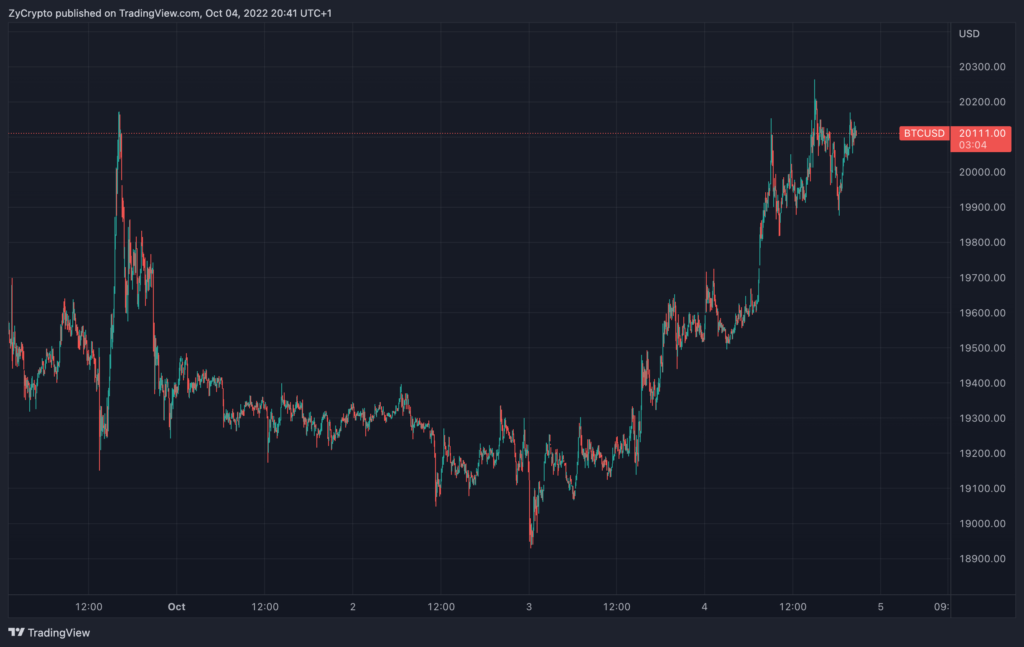
Amidst these promising indications, BTC is silently staging a comeback against the bears. The asset has moved above the support at $19k as it looks to conquer the $20k resistance level. BTC is changing hands at $20,110 as of press time, up 3.63% in the past 24 hours.


