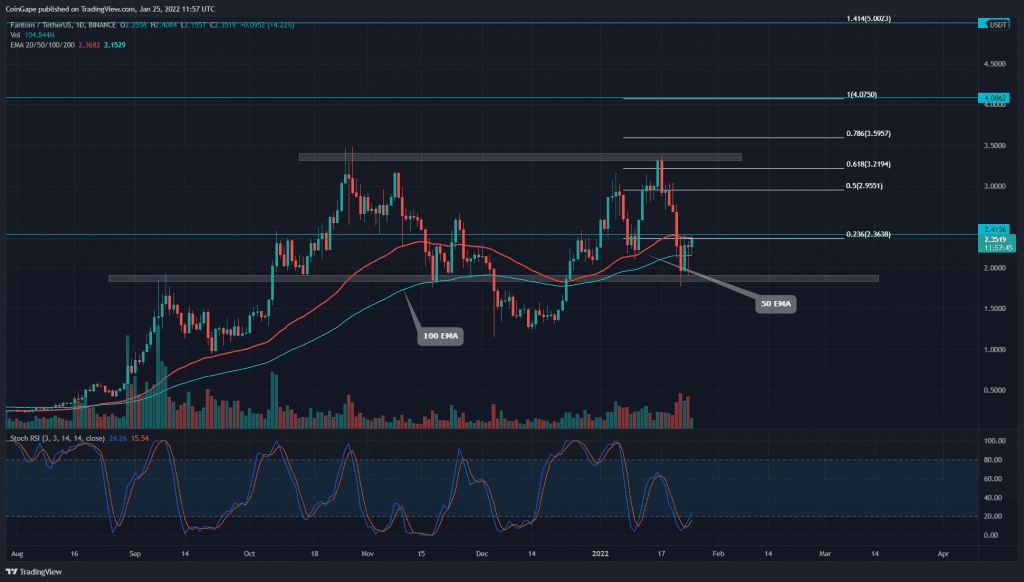
FTM price lost almost half its value in last week’s market carnage. However, the buyers still refuse to drop below the $2 mark, indicating a high point for reversal. Moreover, according to analysis tool DeFiLlama, Fantom has become the third-largest decentralized finance (DeFi) ecosystem in terms of total value locked(12.39B).
Key technical points:
- The daily-Stochastic indicator shows a bullish crossover among the K and D line
- The intraday trading volume in the FTM coin is $2.18 Billion, indicating a 26% hike.
Source- Tradingview
As we mentioned in our previous coverage on Fantom technical analysis, the FTM price slashed by 46% from the All-Time High of $3.48 and plummeted to the $2 support. Coin buyers expressed high interest in this discounted price, resulting in a long bullish candle on the weekend.
On January 24th, the sellers tried to regain control over the coin by pushing it below the $2 mark; however, the increasing underlying bullish rejected the price with a long wick, indicating high demand.
The FTM/USD pair trading above the 100 and 200 EMA maintains a bullish trend. However, the recently flipped 50 EMA resistance puts strong selling pressure on the rising price.
The daily-Stochastic RSI provides a bullish crossover of the K and D line, supporting a bullish reversal.
Double bottom Breakout Hints Recovery Bell For FTM

Source-Tradingview
The recent price jump in FTM/USD has formed a double bottom pattern in the 4-hour time frame chart. The coin price has spiked 23% from the $2 support and now challenges the $2.4 neckline for a bullish breakout.
The 4-hour Relative Strength index(52) shows impressive recovery from the oversold region. Moreover, the RSI slope projects a bullish divergence, projecting a high possibility for a double bottom breakout.
- Resistance levels- $2.4, $2.7
- Support levels are $2 and $1.2


