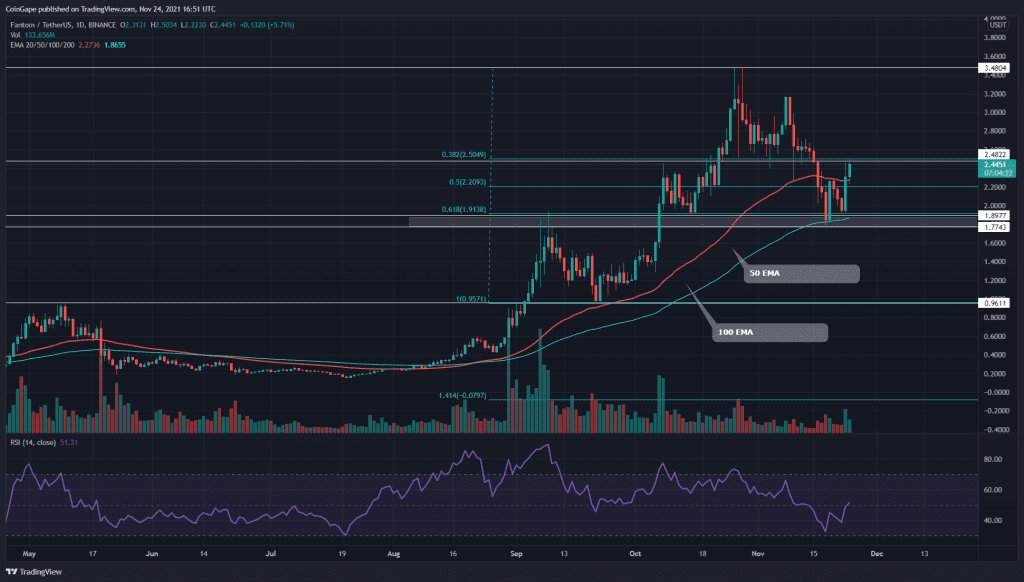
The FTM coin offers an amazing pullback opportunity as the price retraces from the 61.8% Fibonacci level in the daily chart. Moreover, the bullish reversal occurs with the rising three method formation near the $2 mark. Hence, the breakout of the $2.65 mark or the 38.2% Fibonacci level should support a rally to the All-Time High of $.3.48
Key technical points:
- The FTM coin rose more than 25% in the last two days.
- The price action forms a follow-through candle of the rising three method formation.
- The intraday trading volume in the FTM coin is $1.28 Billion, indicating a 5% gain.
Source- FTM/USD chart by Tradingview
The FTM coin shows bullish reversal as it finds support near the 61.80% Fibonacci level resulting in the growth of more than 30% from the $2 mark. Moreover, the rising three method formation helps increase the underlying bullish sentiments.
However, a successful bullish rally above the $3 mark awaits the breakout of the $2.65 mark. After that, traders can find excellent buying entry spot if the price sustains above this level.
The recent bullish reversal breaks above the 20-day EMA after finding demand near the 50-day EMA. Moreover, the crucial exponential moving averages (50,100,200) maintain a bullish alignment. Furthermore, The Relative Strength Index (51) rises gradually in the daily chart as it spikes above the central mark.
FTM/USD Chart In The 4-hour Time Frame

Source- FTM/USD chart by Tradingview
In the 4-Hour chart, the FTM price action denotes a resistance level at the $2.5 mark. Hence, traders must stay careful and keep an eye out for a reversal near the horizontal level.
The traditional pivot shows great confluence with the important levels of this chart. As per these pivot levels, the crypto traders can expect the next resistance after $2.5, at $3. mark, followed by $3.48. As for the flip side, the support levels are $2.15 and $1.65.


