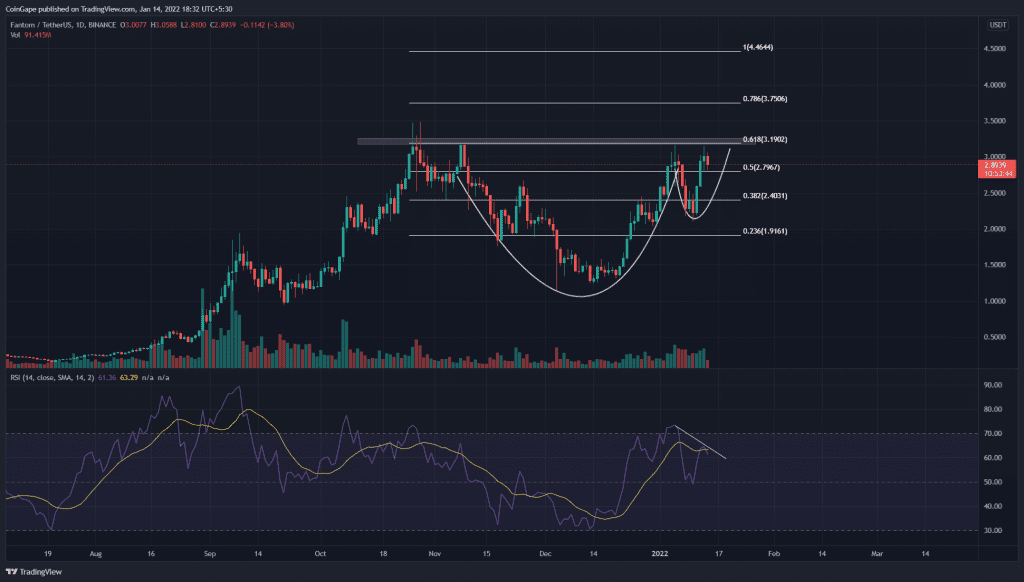
The parabolic recovery in Fantom (FTM) price pumped its price back to the ATH resistance near $3.2. The coin needs face a minor pullback to form the handle portion of its cup and handle pattern. Completing this bullish pattern, the coin price could rally to newer levels.
Key technical points:
- The daily RSI chart shows a bearish divergence.
- The intraday trading volume in the FTM coin is $2.8 Billion, indicating a 12.79% gain
Source- Tradingview
The last time we covered an article on Fantom coin, this pair showed an impressive recovery charging straight to the All-Time High resistance around $3.12. However, the supply pressure across the crypto market triggered another pullback in its price.
This minor dip took support from the $2.2 mark and immediately recovered to the overhead resistance. This whole structure reveals a cup and handle pattern in the daily time frame chart, providing an excellent long trade opportunity.
If the price manages to break out and sustain above this resistance, the Fibonacci extension suggests the next supply zone for FTM price is $3.75 and $4.47-$4.5.
The daily Relative Strength Index (62) shows a bullish sentiment for this coin. However, the chart also shows a bearish divergence, indicating some weakness on the buyer’s side.
FTM Chart Shows A Double Bottom Pattern In The 4-hour Time Frame Chart

Source- Tradingview
The FTM coin is still struggling to surpass the $3.2 resistance. Thus, the crypto traders looking for a new long position in the coin should wait till they break free from this resistance. However, in case the price rejects, the $2.64 and $2.2 support can still carry the bullish rally.
The MACD indicator shows the signal and MACD line are moving above the neutral zone. However, the recent reversal in price has triggered a bearish crossover among these lines.
- Resistance levels- $3.75, and $4.5
- Support levels-$2.64 and $2.2


