Floki Inu price is up 9% on the day and trades in the red after recording three straight bullish sessions between November 28 and December 02. Things are looking good for traders on the daily timeframe but for traders on the shorter time frames, caution should be taken as FLOKI threatens to fall further.
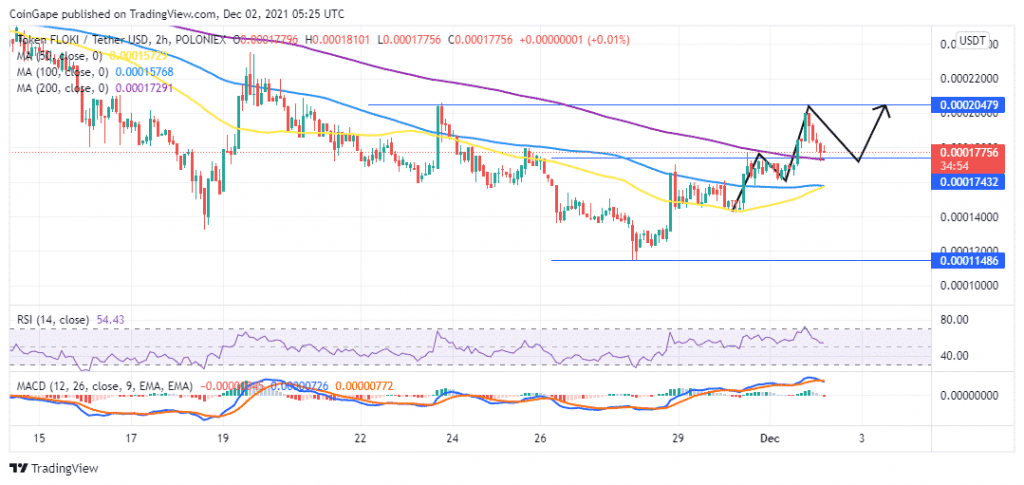
However, if FLOKI is sustained above the 200 period Simple Moving Average (SMA) it might make an impressive comeback with $0.0002050 in the offing.
Floki Inu Price Bulls Should Defend The 200 SMA Support
Floki Inu (FLOKI) is trading at $0.0001775 above the 200-period Simple Moving Average (SMA) at $0.0001743.
Defending this support is crucial for the meme coin bulls as losing this support will pull the FLOKI price towards the $0.00060 psychological level. A drop further could see FLOKI/USDT drop further to tag the $0.00057 level were the 50 and 100 SMAs converge.
This bearish outlook is validated by the downward movement of the Relative Strength Index (RSI) indicator and the Movign Average Convergence Divergence (MACD) indicator. Also, note that the MACD is about to sent a call to sell FLOKI which might take place in the near term when the 12-exponential moving average (EMA) crosses below the 26 EMA.
FLOKI/USDT Two-Hour Chart
On the upside, if Floki Inu price sustains above the 200 SMA, it will make a sharp upswing towards the November 23 intraday high above $0.000205. If this happens, it will represent a 17% upswing from the current price.
The RSI shows that FLOKI was previously in the overbought region indicating that the bulls might still be focused to take Floki Inu higher. Moreover, the MACD line (blue) is positioned above the signal line (orange) indicating that the market is still bullish. Furthermore, the MACD is positioned above the zero line in the positive region indicating that the market sentiment for Floki Inu is positive adding credence to the optimistic outlook.


