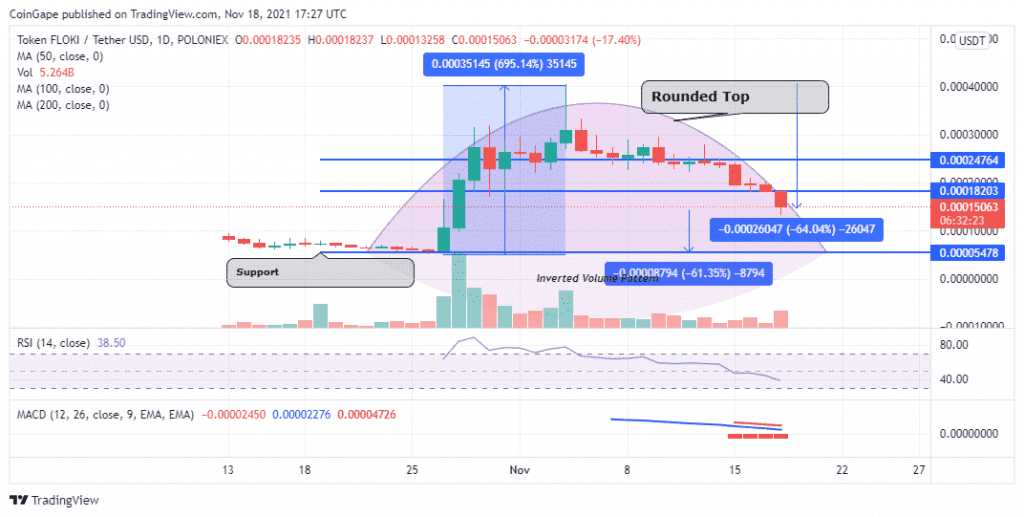
Floki Inu price is 64% below the November 04 all-time high (ATH) at $0.0004020 after rising a massive 695% the October 27 low at $0.00005478. FLOKI is trading in a six consecutive bearish session as seen on the daily chart. As it appears, Floki Inu may drop 61% further if the prevailing chart pattern is confirmed.
Floki Inu Price Rounded Top Pattern Spells Doom
At the time of writing, FLOKI is trading at $0.0001506 and appears to have formed a rounded top on the daily chart. This is a significantly bearish chart pattern that results in a change from an uptrend to a downtrend. The target of the rounded top pattern is the support price level found at the base of the pattern.
In this case, continued Floki Inu price correction could see the meme coin drop towards the $0.00005478 support base as shown on the daily chart. This represents a 64% drop from the current price.
FLOKI/USDT Daily Chart
Note the position of the RSI at 40 close of the oversold zone indicate that the bears are firmly in control of the Floki Inu price.
Traders should also watch the volume when analysing a rounding top patter. The volume usually assumes an inverted volume (high on either end, lower in the middle of the pattern) as shown in the same chart.
On the flipside, the position of the Moving Average Convergence Divergence (MACD) indicator above the zero line in the positive region still points to a positive market sentiment for FLOKI. Therefore, A daily closure above the $0.0001823 resistance level could bolster the bulls to push Floki Inu higher.
A decisive bullish breakout will be confirmed if FLOKI price rises to above the $0.0002476 resistance level invalidating the above bearish outlook.
However for this to happen, Floki Inu price bulls might need support from the wider market to restart the bullish run.


