Disclaimer: The findings of the following analysis are the sole opinions of the writer and should not be considered investment advice.
Bitcoin has been unable to climb above the $44.4k-$44.6k resistance in the past couple of days. In fact, there was the possibility that the price would drop toward $42,000 in the next few days. At the same time, Polkadot has been unable to breach the mid-point of a range it has been trading within. This could see the price of Polkadot descend. Therefore, it was a time to wait and watch what the market had in store. And, probably not the time to actively take positions on DOT.
DOT- 1H
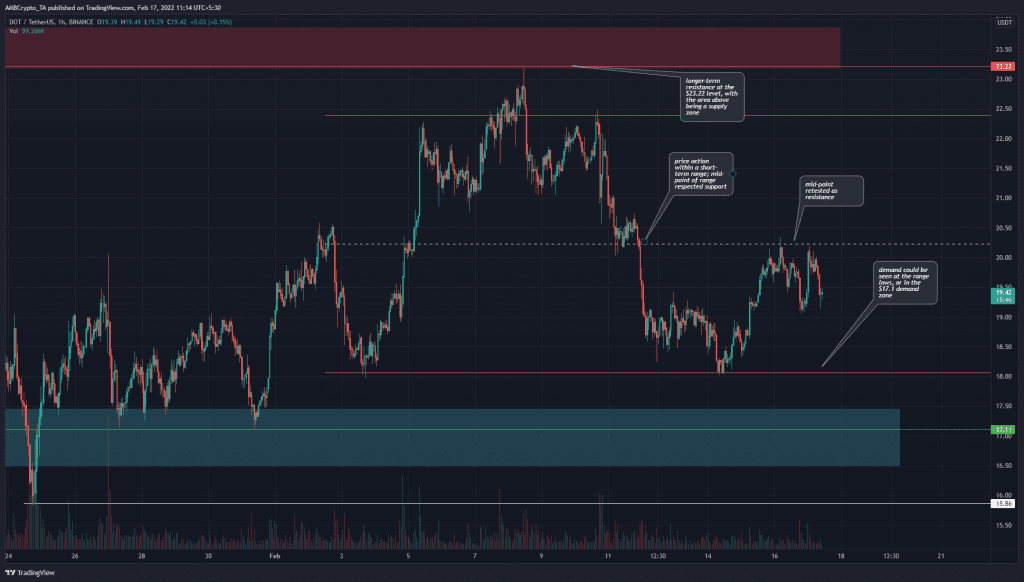
On a short-term outlook for Polkadot, the price has been trading within a range (orange) since early February. The price did rise above the range highs but was rejected at the $23.22 level, which had also acted as a supply area in the past.
The mid-point of this range lay at $20.23. Furthermore, in the past few days, the price has respected this level. Initially, it acted as support but then gave way to selling pressure post 11 February. In the past few hours, this same level has acted as resistance. Thereby, indicating that DOT could be headed back to the range lows once again.
Below $18, the $17.11 support level as well as the whole area from $16.5-$17.5 (cyan box) were areas where demand stepped in. On longer timeframe charts, this area holds some significance and could be retested if $18 is broken.
Rationale
The Awesome Oscillator dropped back below the zero line in the hours prior to the time of writing. Thus, showing bearish momentum once more. Moreover, during the time DOT was trading within the short-term range from $18-$22.39, the oscillator has been extremely bullish as well as bearish. This was consistent with lower timeframe momentum indicators, which oscillate from strongly bearish to strongly bullish when the price visits the range lows and highs respectively.
The OBV has been in a downtrend in the past week when the price dropped from the highs to the lows. This was again a confirmation that bulls had the driving seat on the way up, and bears on the way down.
Conclusion
No divergences or inconsistencies were seen in the near term with respect to either momentum or volume in the past couple of weeks. The $18 and $17.11 levels could present buying opportunities, provided Bitcoin does not see a sharp drop in the coming days.


