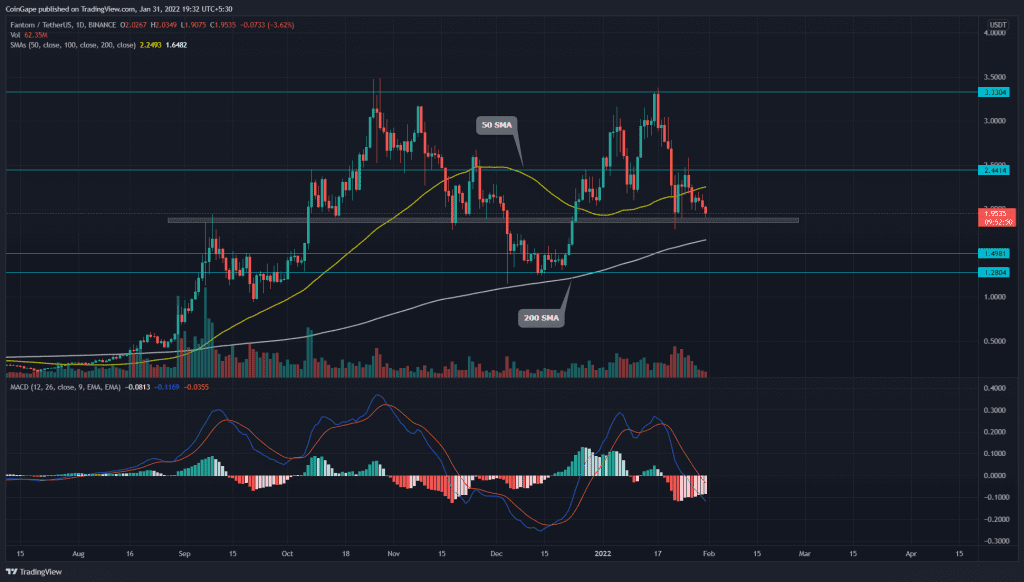
The correction phase began in mid-January has tumbled the FTM price by 50%. The buyers are currently holding the $1.85 mark to regain their bullish momentum. However, a falling resistance trendline reverts any bullish attempts and threatens to dump the coin to a monthly support level of $1.25.
Key technical points
- The MACD indicator lines nosedived below the neutral zone(0.00)
- The intraday trading volume in the FTM Network coin is $1.81 Million, indicating a 20% loss.
Source- Tradingview
Last week, the FTM/USD pair showed a relief rally to $2.45. However, a shooting star candle on January 26th, indicating the sellers were defending this level and pushed the coin price back to the $1.85 support.
- If the bulls couldn’t sustain the price above the $1.85 mark, the FTM price would sink to $1.5 or $1.25. Conversely, if the coin price experiences strong demand from the bottom support, it would hint the buyers are interested in this dip, maintaining a reversal opportunity in the upcoming sessions.
- The FTM price trading above the 200 SMA line indicates the coin sustains its bullish trend. On the other hand, the other SMA lines(20, 50, 100) roaming above the coin price can offer strong resistance during a bullish reversal.
- The moving average convergence/divergence indicator shows the MACD and signal have plunged into bearish territory. However, the faded red bars in the histogram chart show a slight weakness in the selling momentum.
Descending Trendline Restricts Bullish Activity in FTM

Source- Tradingview
The FTM price is narrowing between two crucial technical levels i.e., the $1.85 support level and the descending resistance trendline. Violating either of these levels could indicate the first signal of the following rally.
- Resistance level- $2.18 and $2.45
- Support levels- $1.85 and $1.55


