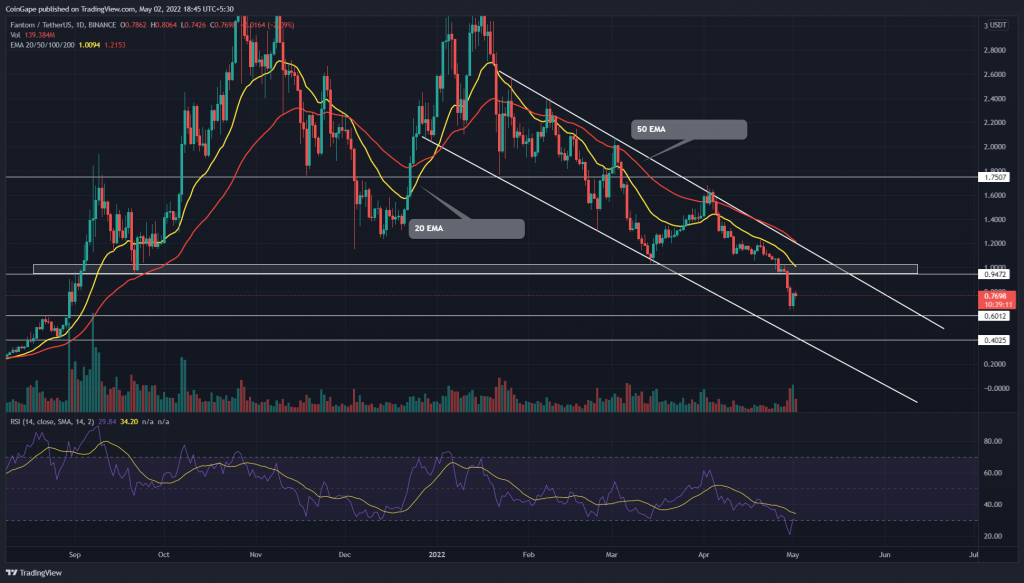
A falling channel pattern governs the current Fantom(FTM) downtrend. The recent bear cycle initiated from the $1.67 has breached the $1 psychological support, registering a 53.8% loss. Furthermore, the FTM price would continue to dive deeper until the pattern is intact.
Key points
- The daily-RSI slope slumps into the oversold region
- The bullish breakout from the channel pattern would trigger a strong up move
- The intraday trading volume in the FTM Network coin is $925.4 Million, indicating a 4.7% gain.
Source- Tradingview
Since the late January sell-off, the Fantom(FTM) price has been resonating in a falling channel pattern. The slow and steady rally has provided four swing highs to the resistance trendline and three swing lows to the support trendline, indicating the traders respect the channel pattern.
Lowering within this pattern, the FTM holders lost some crucial support levels such as $1.75, $1.25, and recently the $1 physiological level. As sellers continue to pressurize altcoin lower, the price may soon reach the $0.6 support level, followed by the shared support of $0.4 and the support trendline.
However, any unexpected pullback may retest the $1 flipped resistance to renew the bearish momentum.
Trending Stories
Having said that, the falling channel pattern is known to trigger a directional bull run if buyers manage to breach its resistance trendline. Therefore, the interested buyers should be patient and wait for the trendline breakout to grab a long opportunity.
Technical indicator
The declining EMAs(20, 50, 100, and 200) reflect an overall bear trend for the Fantom coin. Moreover, the 20-and-50-day EMA acts as dynamic resistance to the coin price, keeping the bullish pullback in check.
However, The daily-RSI slope has fallen into the oversold region suggesting the sellers may have extended the current downtrend. Thus, if bullish momentum returns, the altcoin is expected to break through this channel pattern.
- Resistance level- $1 and $1.25
- Support levels- $0.6 and $0.4


