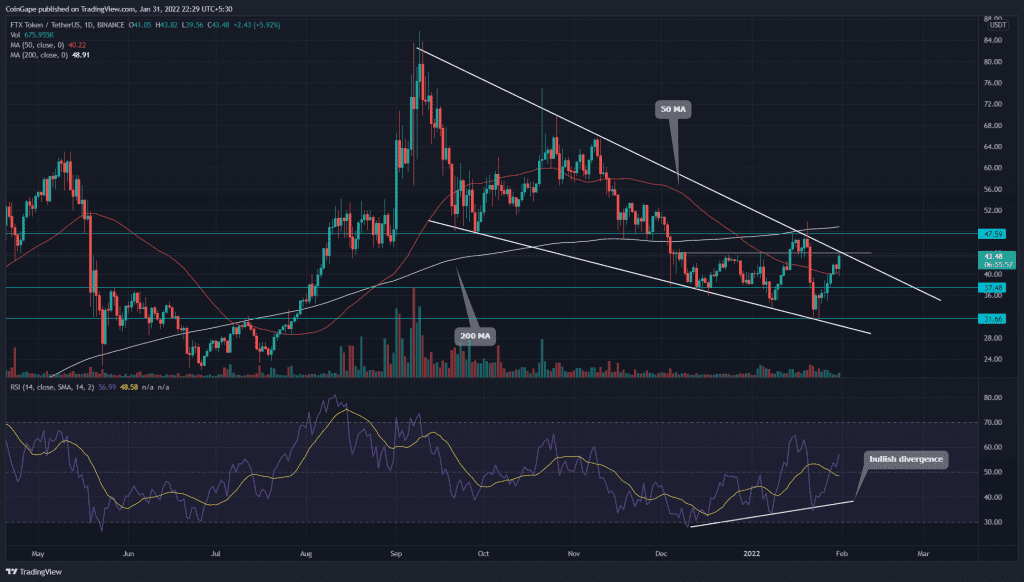
The FTT buyers made an impressive recovery last week, reclaiming the $37.5 and 50 MA line along the way. The coin price preparing for a bullish breakout from the falling wedge pattern indicates a possible trend reversal.
Key technical points:
- FTT price reclaim 50-day MA line
- The daily-RSI chart shows a bullish divergence
- The intraday trading volume in the FTT token is $185.9 Million, indicating an 84.8% gain.
Source- Tradingview
The FTT/USD technical shows a falling wedge pattern in the daily time frame chart. The current downtrend strictly follows this pattern, providing multiple retests to its trendline. The buyers made a V-shaped recovery from the recent bloodbath, gaining 38% from the recent lower low of $31.66.
- The recent price jump soars above the 20 and 50 MA, providing more edge to buyers. However, the token price trading below the 200 MA signals an overall bearish trendline.
- The daily-Relative Strength Index(57) slope has surged above the 14-SMA and 50% mark forming a bullish divergence. This indicates the bulls are preparing for a comeback.
Ascending Trendline Leads Recovery Rally In FTT

Source-Tradingview
The FTT price recovery rally currently challenges a share resistance of $44 horizontal level and the descending trendline. If buyers could give a breakout and daily-candle closing above the overhead resistances, the crypto traders can consider entering a long position.
Contrary to this assumption, if supply pressure turns the coin price back from this resistance, the chart pattern will remain intact, and the Alt may plunge to the bottom support trendline. Moreover, a short rising trendline would provide an early signal for sellers dropping the coin to lower levels.
The traditional pivot levels indicate the overhead supply region for FTT price is $44, followed by $47.5. As for the flip side, the demand regions are at $37.8 and $34.


