While there are no clear bullish reversal signs, FTX Token (FTT) is trading just above a confluence of horizontal and Fib support levels.
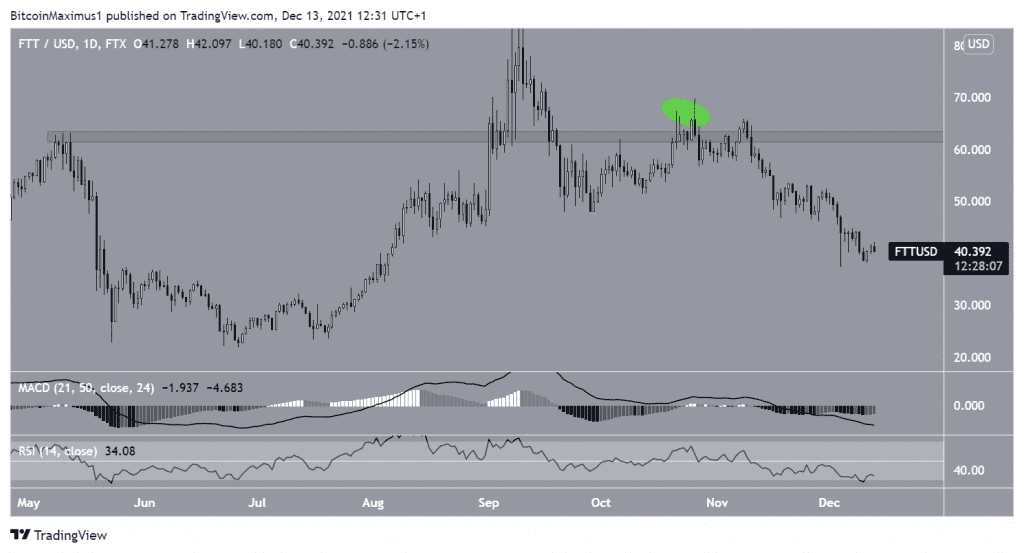
FTX has been moving downwards since Sept 9, when it reached an all-time high price of $84.7. While attempted to initiate an upward movement, this only led to a deviation above the $62.50 area on Oct 25 (green circle). The $62.50 area is now expected to act as resistance.
So far, it has reached a low of $37.4, doing so on Dec 4.
Technical indicators are bearish. The MACD, which is created by a short- and a long-term moving average is negative and decreasing. The RSI, which is a momentum indicator is decreasing and is below 50.
Both of these are bearish signs that are often associated with downward trends.
Short-term bounce
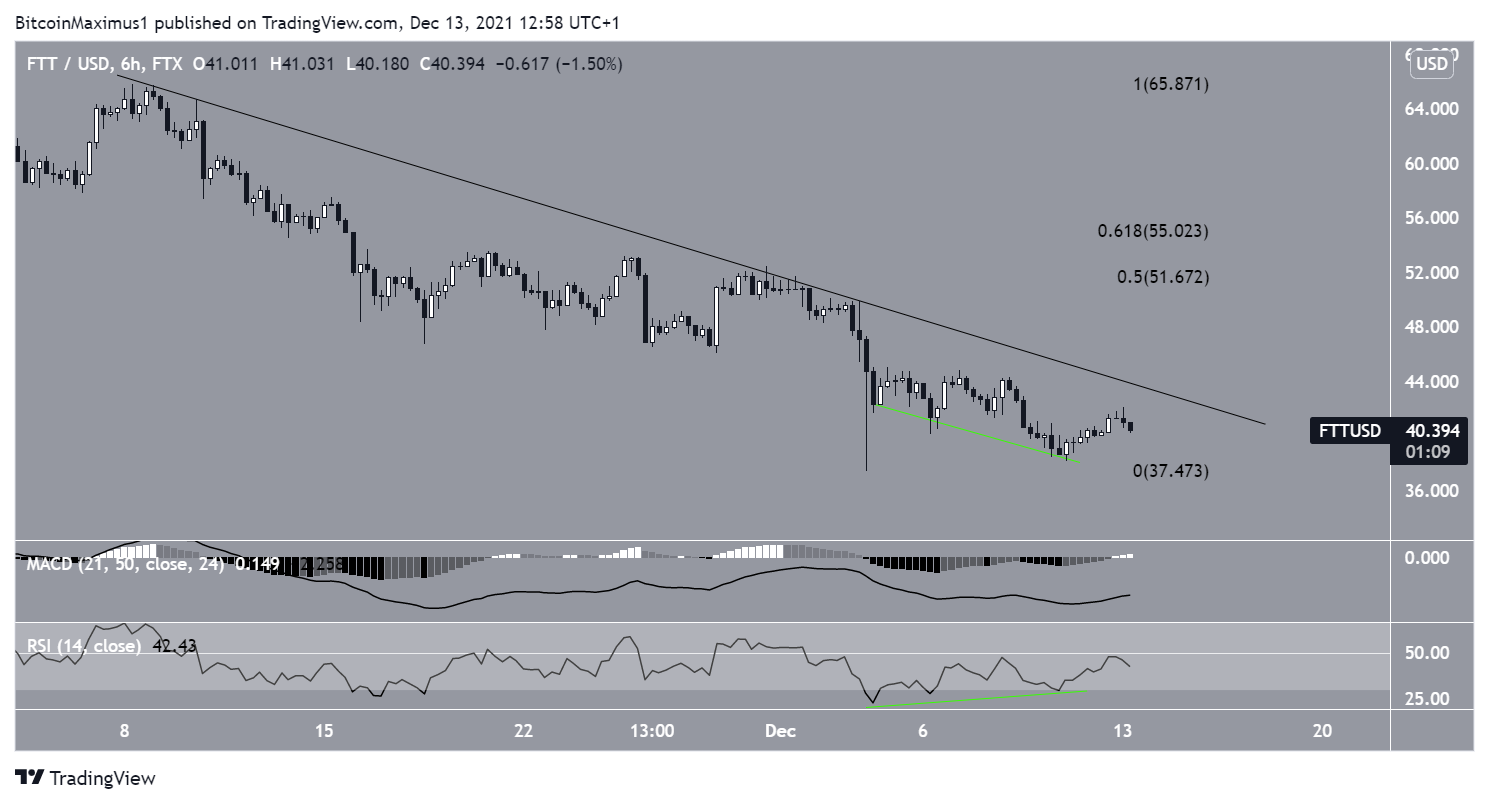
The shorter-term six-hour chart is more bullish.
It shows that FTT has created a higher low relative to the price on Dec 4. In addition to this, the RSI has generated bullish divergence (green line). This is a bullish sign that often preceded bullish trend reversals.
In order to confirm this reversal, the token has to break out from the short-term descending resistance line in place since Nov 8.
If it is successful in doing so, the next resistance would be between $51.6 and $55, the 0.5-0.618 Fib retracement resistance levels.

FTT wave count
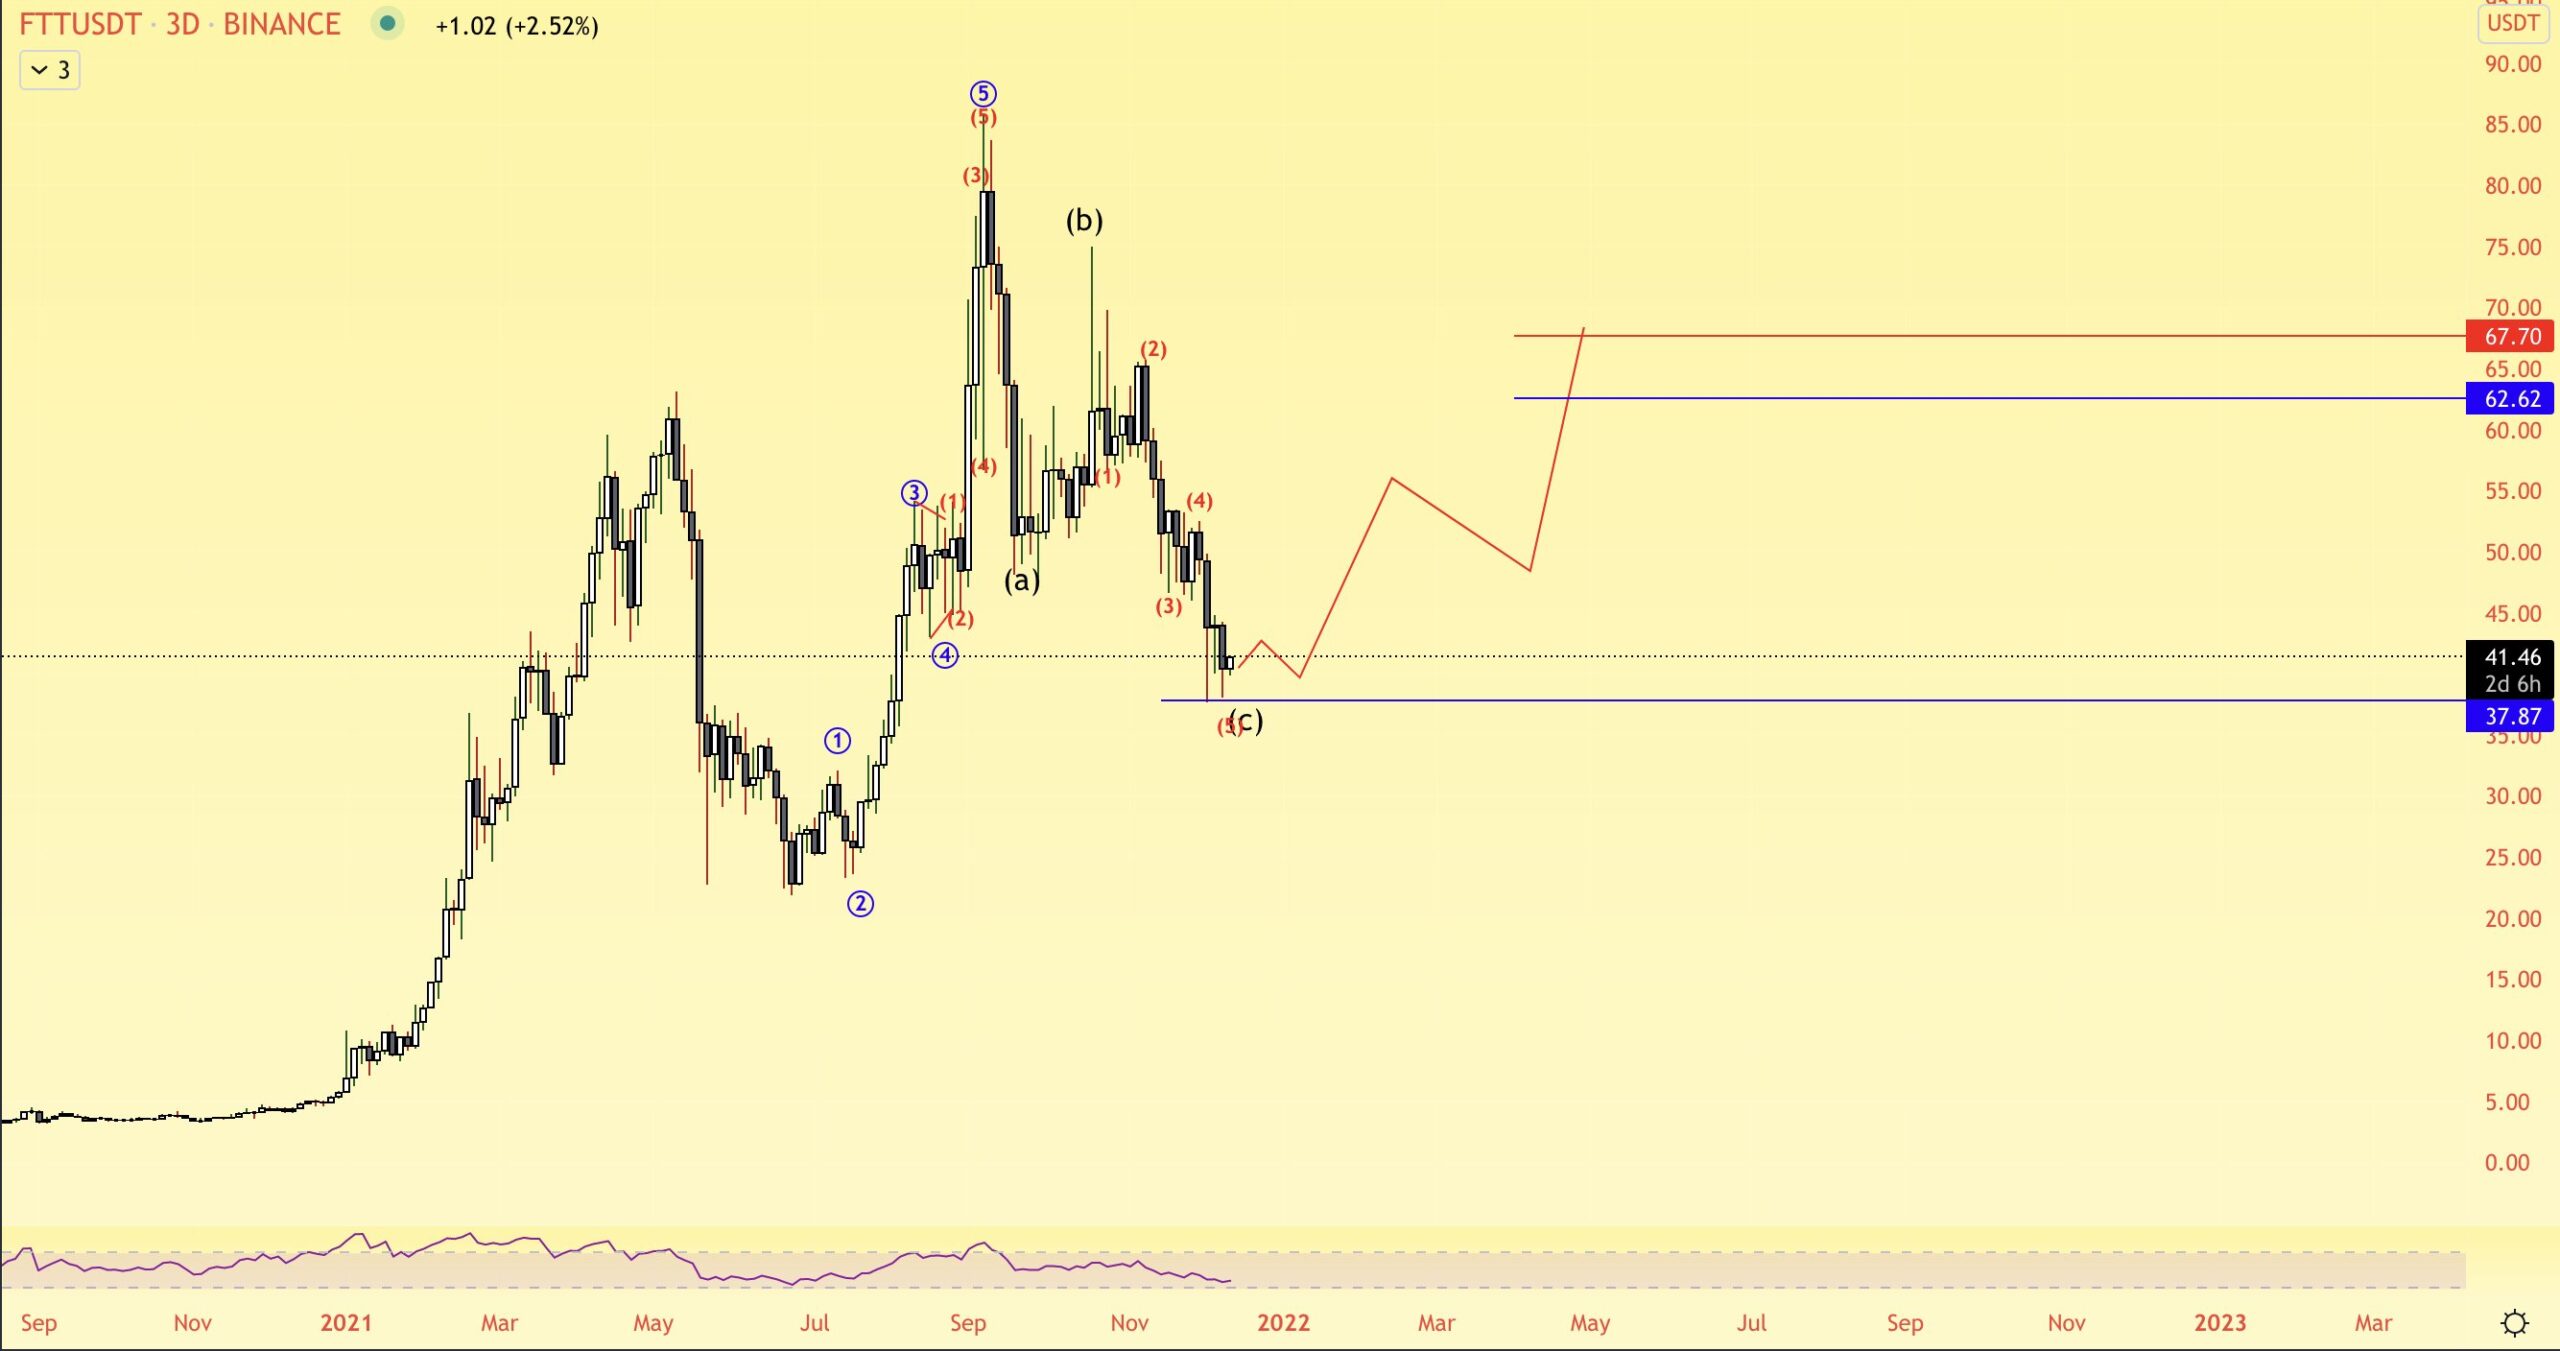
Cryptocurrency trader @Altstreetbet outlined a FTT chart, stating that the token has completed its correction.

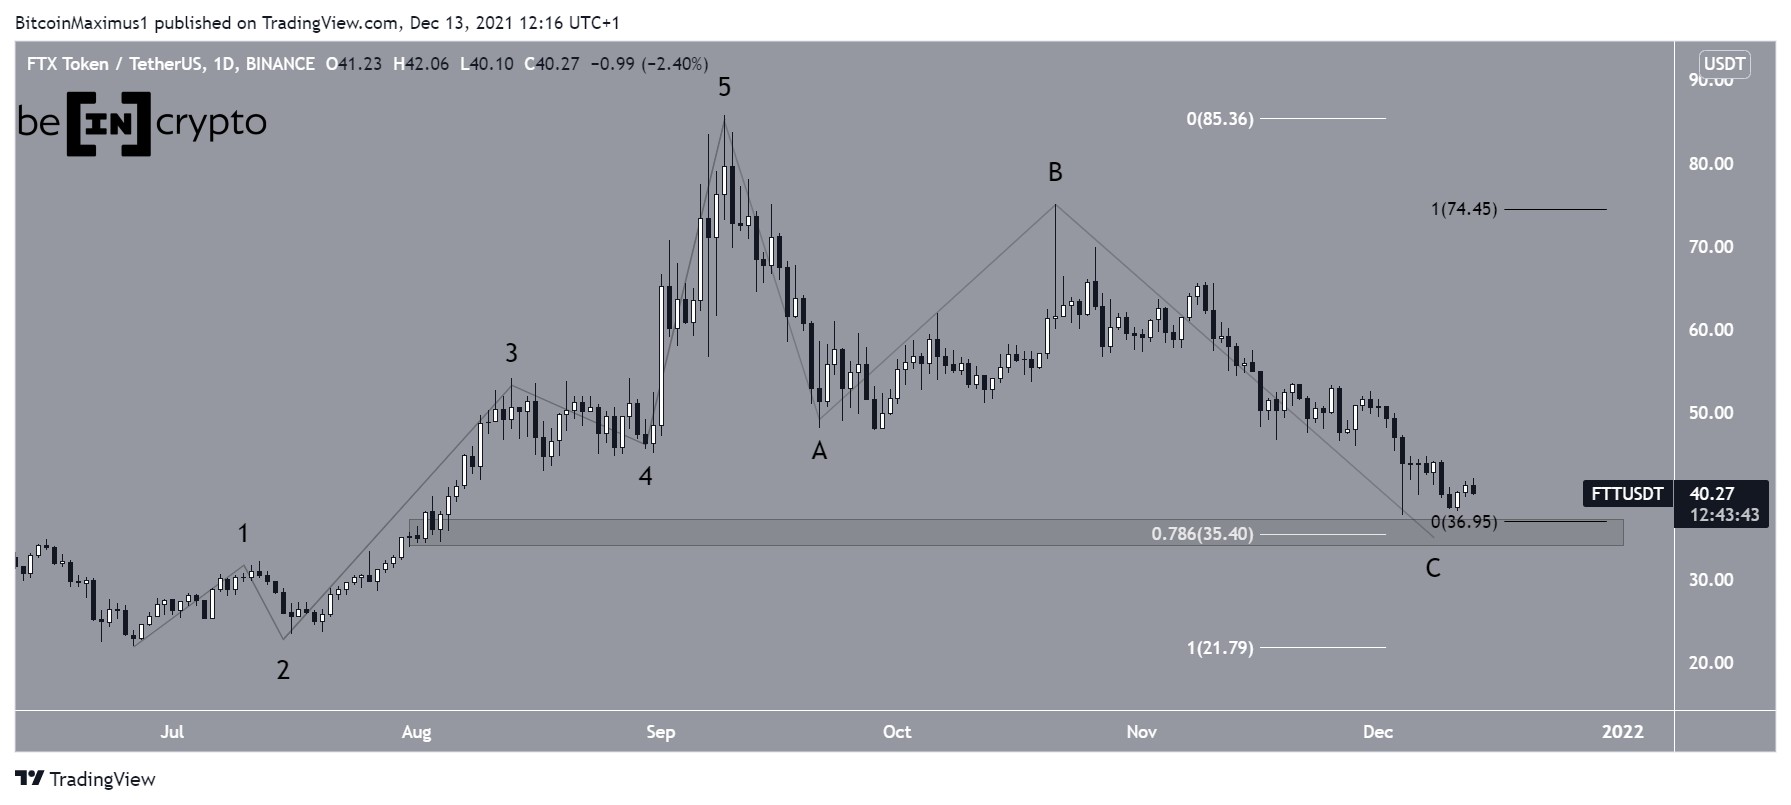
The wave count does indeed suggest that an A-B-C corrective structure is complete. This means that the upward trend that transpired from late June to the Sept 9 all-time high price could resume.
FTT is just above the 0.786 Fib retracement support at $35.40, which is also a horizontal support area. In addition to this, waves A:C have an exactly 1:1 ratio, which is very common in such corrective structures.
Therefore, it is very possible that the correction is complete.

For BeInCrypto’s latest Bitcoin (BTC) analysis, click here.
Disclaimer
All the information contained on our website is published in good faith and for general information purposes only. Any action the reader takes upon the information found on our website is strictly at their own risk.


