Published 21 mins ago
The Bitcoin technical chart showcased a roller coaster ride as prices took a V-top reversal during Mid August and dumped back to 2022 bottom support of $18000. Moreover, over the last weeks, the crypto market suffered due to unfavorable news such as High CPI data, Fed interest hike, and the U.S. dollar index(DXY) rise to a 20-year high. As a result, the market participants’ fear of further downfall has increased.
advertisement
Key points from Bitcoin price analysis:
- Bitcoin Fear & Greed Index has dropped to 24%, signaling extreme fear among market participants.
- Interested traders should wait for the Bitcoin price to breach the triangle pattern barriers before they position their funds.
- The intraday trading volume in Bitcoin is $22.6 Billion, indicating a 35% loss.

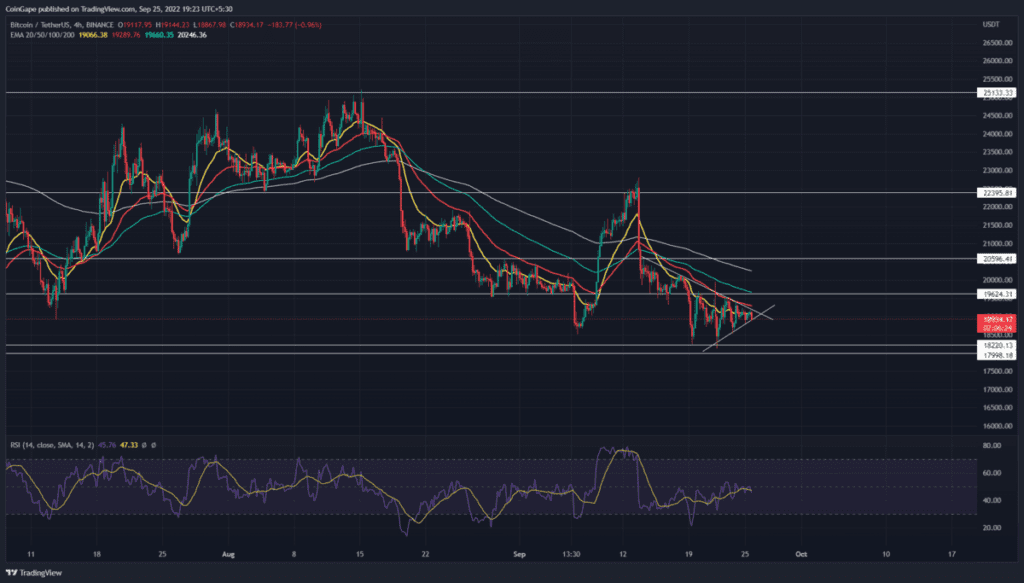
Source-Tradingview
The Bitcoin retested the bottom support zone at $$18200-18000 on September 19th. However, even a week has nearly passed, the BTC price is still wavering around this support. This consolidation indicates uncertainty in market participants.
Anyhow, the 4-hour time frame chart reflects this consolidation as the formation of a symmetrical triangle pattern. In theory, this pattern usually resumes the prevailing trend after a short period of break; however, a breakout on the other side is quite possible.
Trending Stories
Today, the Bitcoin price is trading at the $19062 mark and shows a 0.7 intraday gain. Furthermore, the two convergence trendlines have narrowed the prices enough to be considered a no-trading zone.
Therefore, a breakdown below the support trendline will intensify the ongoing bearish trend and plunge the Bitcoin price below the $18000 mark.
On a contrary note, a candle closing above the resistance trendline will signal an early sign of bullish reversal. As a result, the coin holders may witness another upswing.
Technical Indicator
RSI: Contrary to the sideways price action, the rising RSI slope indicates growth in underlying bullishness. Moreover, this positive divergence encourages a bullish breakout from the triangle pattern.
advertisement
EMAs: the downsloping crucial EMAs(20, 50, 100, and 200) indicate any potential rally would face multiple resistance on its way up.
- Resistance level- $19600 and $20600
- Support level- $18000 and $16500
Share this article on:
The presented content may include the personal opinion of the author and is subject to market condition. Do your market research before investing in cryptocurrencies. The author or the publication does not hold any responsibility for your personal financial loss.