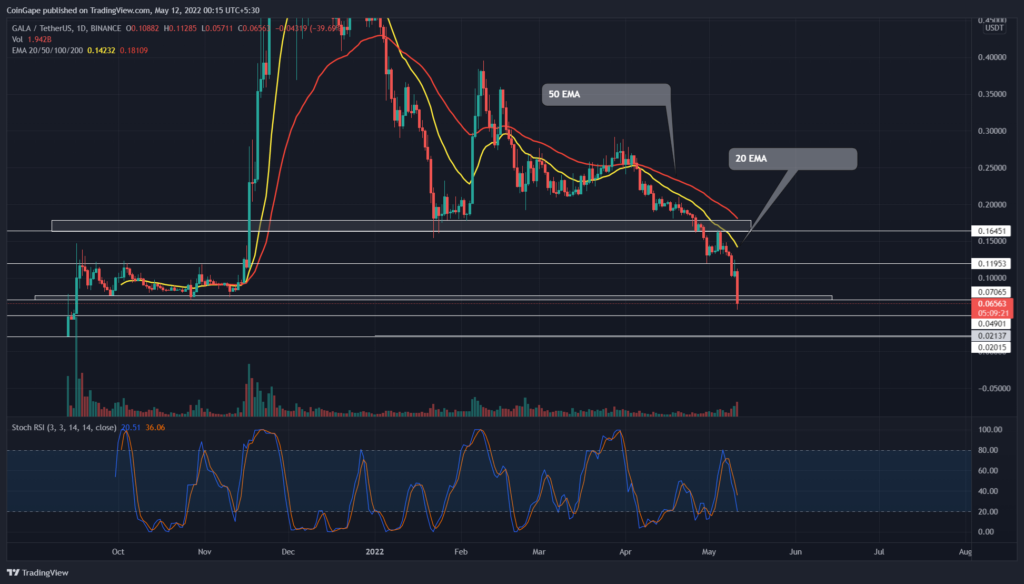
The GALA holders losing the monthly support of $0.165 released the awaiting selling momentum. The extended correction has recently breached the $0.07 support, registering a loss of 62%. If sellers show sufficient sustainability below this breached support, the follow-up downfall will hit the $0.05 psychological level.
Key points:
- The GALA price weekly chart shows six consecutive red candles.
- The daily-RSI slope slumped into the over the region
- The intraday trading volume in the GALA is $352 Million indicating a 104% gain
Source- Tradingview
For the first four months of 2022, the GALA buyers aggressively defended the $0.178-$0.166 support zone. However, the formation of new lower highs indicated the sellers were exerting higher pressure on the coin price.
As a result, on April 29th, the GALA price broke down from $0.166 support, suggesting the resumption of the prevailing downtrend. The post retest fall breached the immediate support of $0.12 and depreciated the altcoin by 55%.
Furthermore, the GALA price retests the Sep-Oct 2021 bottom support of $0.07, threatening a fallout possibility. If sellers successfully breach this bottom support, the traders may witness a freefall to the $0.05 mark, followed by $0.02.
Trending Stories
On a contrary note, if buyers revert the altcoin from $0.07 support, the potential rally may retest the $0.12 mark. Reclaiming this flipped resistance is crucial for traders to initiate a genuine recovery.
advertisement
Technical Indicator
EMAs: the expanding gap between the downsloping EMAs suggests rising pressure. In addition, the 20-day implies constant resistance to the GALA price.
RSI: the sudden price drop has pulled the daily-RSI slope into the oversold territory. However, this overextended selling indicates that altcoin may witness a minor relief rally
Stochastic RSI: A sharp drop in the K and D line suggests a rise in underlying bearish momentum with no weakness.
- Resistance level- $0.07, and $0.12
- Support level- $0.05, and $0.02


