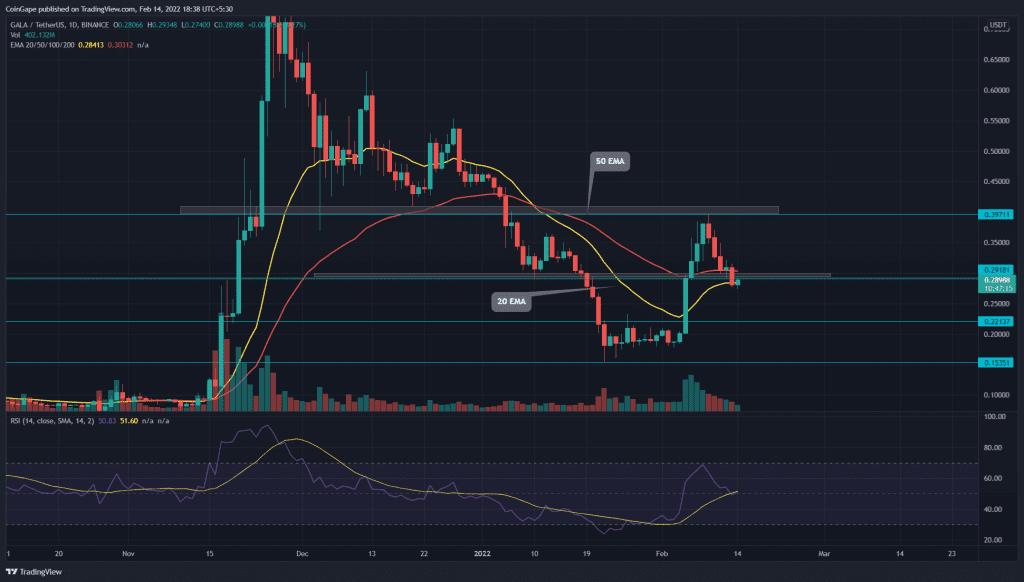
The GALA price recovery turned down from the $0.39-0.4 resistance zone. The altcoin currently trading at $0.287 indicates a 30% loss in the last six days. The sellers breached the immediate support of $0.29, suggesting the correction would continue.
Key technical points:
- GALA price sinks below the 20-and-50-day EMA
- The RSI sloped entering the bearish zone
- The intraday trading volume in the GALA is $893.6 Billion, indicating a 1.85% loss.
Source- Tradingview
During the recent price recovery, the GALA buyers knocked out two significant resistance of $0.22 and $0.28. Last week the altcoin registered a 115% gain and surged to the $0.397 mark. However, the sellers defended this resistance with vigor and pulled the price back to $0.28.
The buyers were struggling to rebound from this possible support, but the overpowered sellers pierced the $0.28 support with a long bearish candle on February 13th. The altcoin might retest this breached support before the down rally continues.
This recent retracement plunged the GALA price below the 20-and-50 EMA. Flattening of these EMA lines indicates the buyers are losing their grip.
The Relative Strength Index(49) slope nosedive below the 14-SMA line and equilibrium, projecting a bearish sentiment among the crypto traders.
Descending Trendline Check For Bear Trend Pullbacks

Source- Tradingview
The 4-hour time frame chart shows a steady downfall with a lower high and lower low. The descending trendline helps bears to sell on rallies, and until it remains intact, the crypto traders can expect further correct in price.
If sellers sustain below the $0.29 mark, the GALA/USD pair would slide to the $0.22 mark.
- Resistance level: $0.29-$0.3 and $0.4
- Support levels $0.22 and


