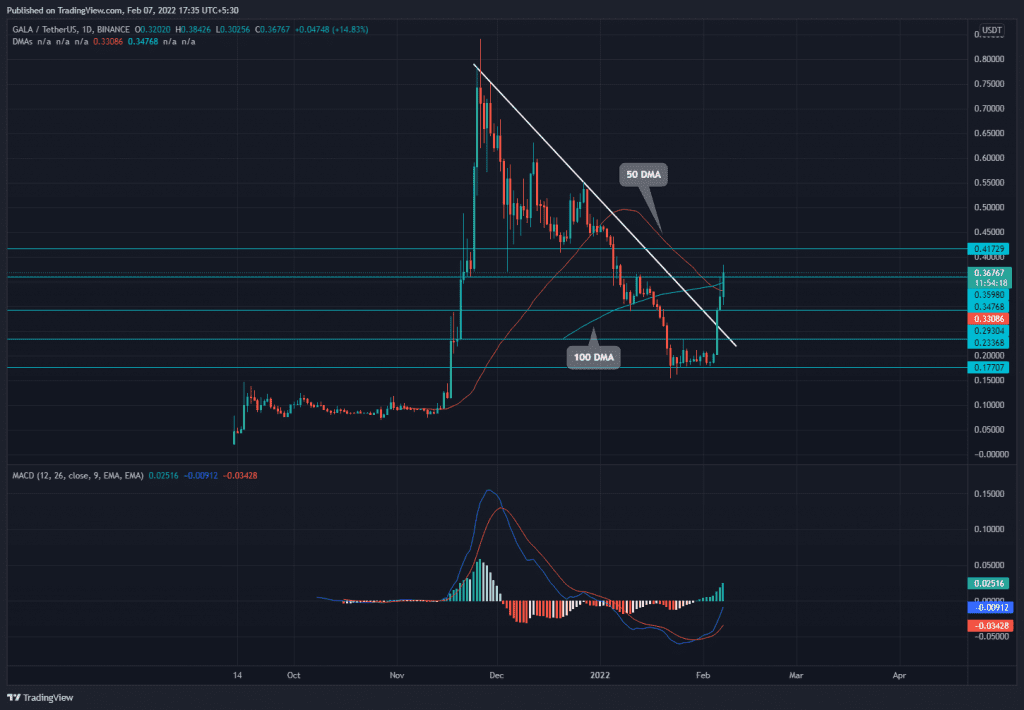
The GALA/USD pair has doubled in the last 3-4 trading days. The sudden recovery in GALA price has reclaimed some significant resistance($0.3, $0.36)and DMAs(50, 100) along the way. The bulls trying to hold above the $0.36 aims their next target at $0.42.
Key technical points
- The daily-MACD indicator signals rising bullish momentum in GALA price.
- The intraday trading volume in the GALA is $2.25 Billion, indicating a 7.59% loss.
Source- Tradingview
In our previous coverage on GALA/USD, Coingape foretold about the upcoming bullish recovery, when altcoin breached the shared resistance of $0.23 and descending trendline.
Furthermore, the sustained bullish momentum drove the token even higher and pierced through two other significant resistance of $0.347 and $0.36, suggesting more to the rising rally.
Along with a $0.36 breakout, the GALA buyers also poked the 50-and-100-day DMA. If token price could sustain this level, the long traders would get an excellent edge for bullish recovery.
The MACD indicator shows the MACD and signal lines have taken a sharp upturn after the bullish crossover in the negative territory. The histogram chart displays a constant rise in green bars, indicating a strong buying momentum.
Will GALA Price Retest $0.36 Mark?

Source- GALA/USD chart by Tradingview
The GALA price currently trading at $0.367, indicates a 106.18% gain from the $0.178 bottom support. The buyers have provided a 4hr- candle closing above the $0.36 resistance; however, the token is expected to retest the same level to confirm this breakout.
If bulls could sustain the above $0.36 mark, the altcoin would rise to the immediate resistance of $0.418.
The super trend indicator accentuates a bullish trend in the 4hr-time frame chart.
- Resistance levels- $0.42 and $0.47
- Support levels- $0.36 and $0.3


