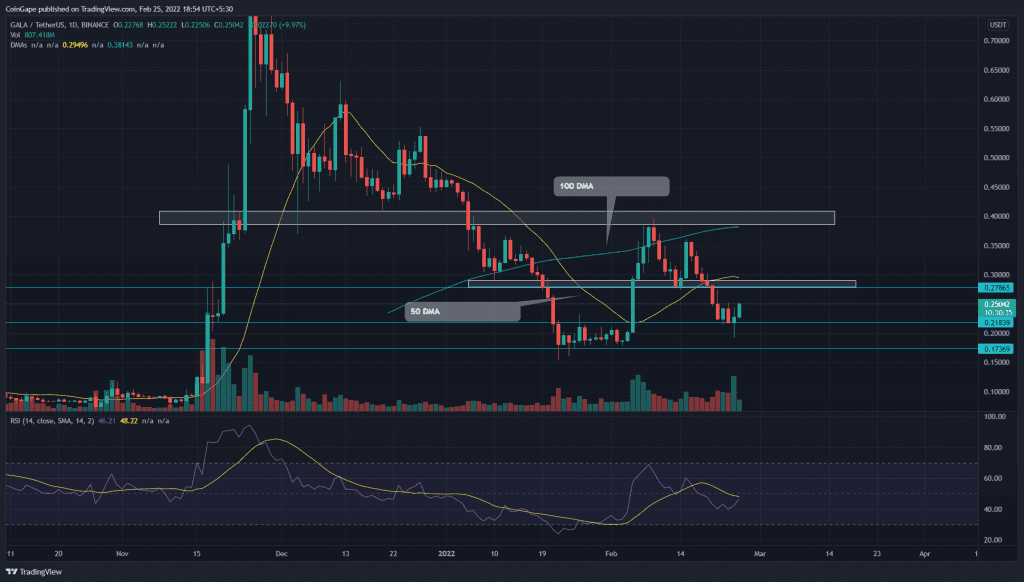
On February 16th, the Gala Games (GALA) price turned down from the $0.357 mark. Amidst the recent sell-off in the crypto market, the coin chart shows six consecutive red candles, which slumped the coin price to $0.215. However, the price action suggests a bullish reversal from this support, aiming above the $0.3 mark.
Key technical points:
- The daily-RSI slope is poised to enter the bullish territory
- The intraday trading volume in the GALA is $1.9 Billion, indicating a 16.2% hike.
Source- Tradingview
The GALA price failed to follow up the recovery rally initiated on February’s third week. GALA coin price turned down from the $0.357 mark and lost 20% in hitting the $0.28 local support. A formation of a double top pattern in the daily time frame chart bolstered the selling pressure and plunged to a prior resistance of $0.218.
The long-tail rejection candle on Feb 24th, indicating the buyers are aggressively defending this support. Today, the 11% intraday growth provides a strong follow-up with the formation of a morning star candle pattern.
The Relative Strength Index(46) slope is on the verge of crossing above the equilibrium, indicating a positive turn in trader’s sentiment.
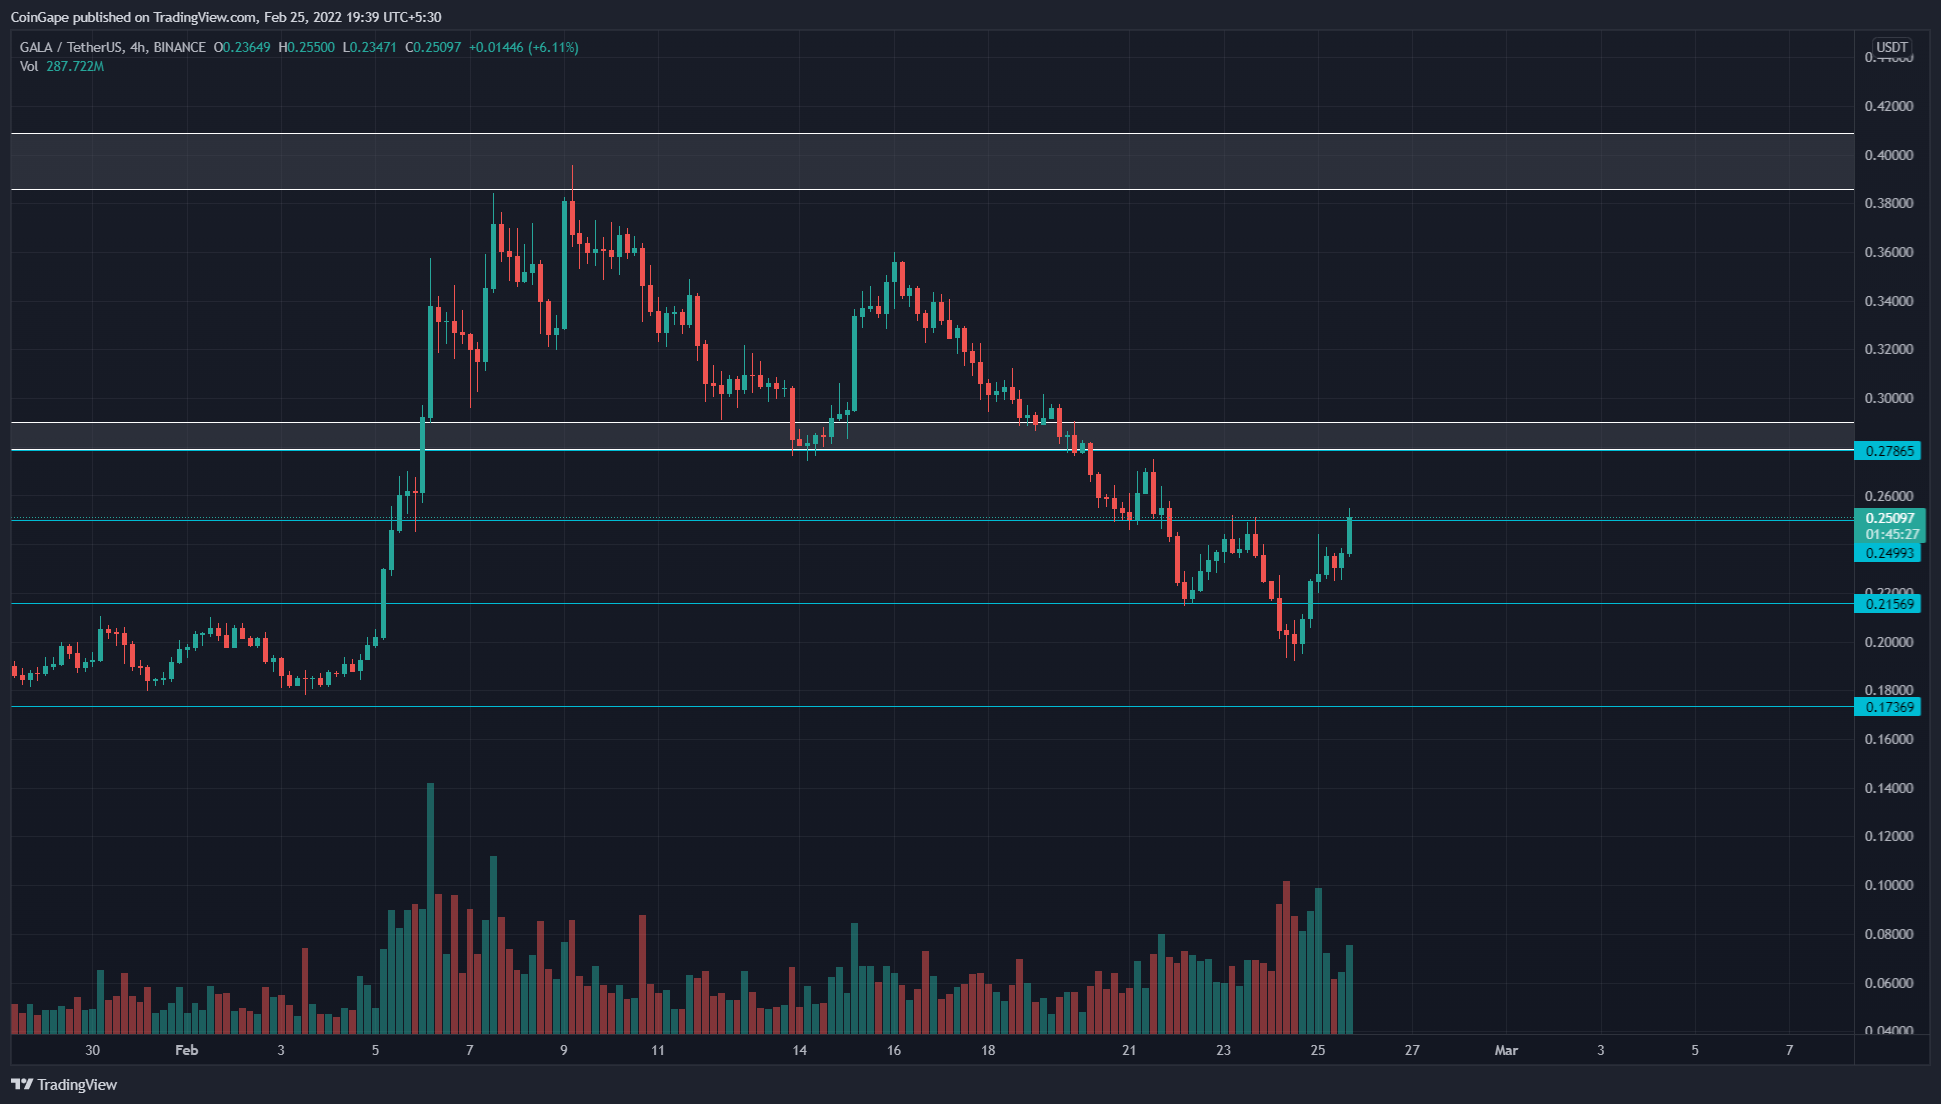
GALA/USDT: 4-hour time frame chart

Source- Tradingview
The bullish reversal from the $0.215 support has surged the GALA price to the $0.25 mark, indicating a 13.45% gain. The buyers are attempting to breach a minor resistance at $0.25. If they succeed, the buyers would re-challenge the shared resistance of $0.285 and 20 DAM, which is the key level to initiating a recovery.
On a contrary note, if sellers revert the GALA from the $0.285 mark, the coin price would retest the $0.215, posing a risk of a downtrend continuation.
The GALA price trading below the crucial DMAs(20, 50, 100, and 200) maintains a bearish trend. These overhead DMA lines could act as valid resistance to the coin price.
- Resistance level- 50-day SMA, $0.285
- Support level-$0.215, $0.177


