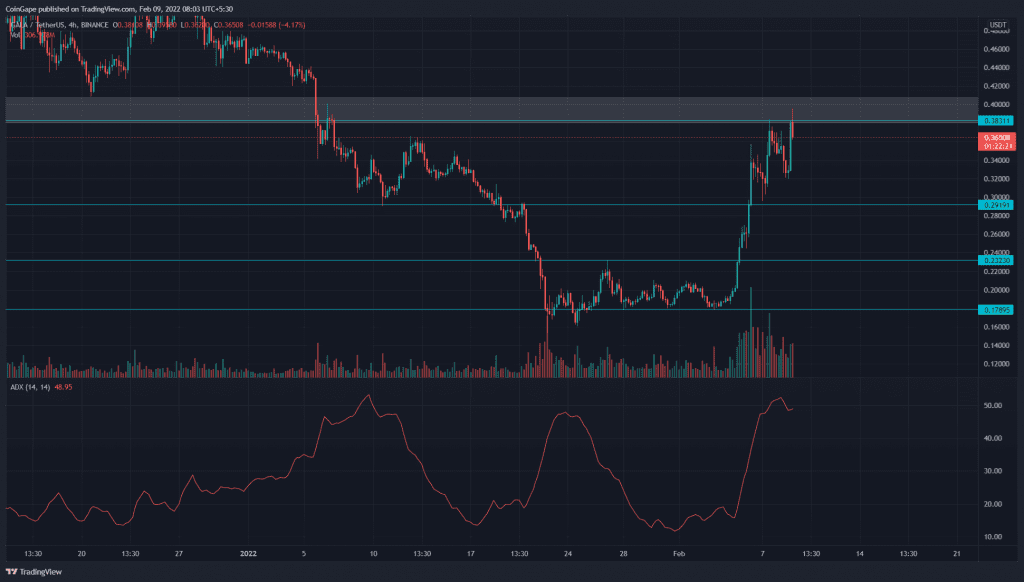
GALA price rebounded from the $0.18 support with a morning star candle and surged 108% after hitting the monthly resistance of the $0.38 mark. The reason for such swift recovery in GALA price could be multiple factors like the launch of new games and features on the protocol, Several new partnerships(888innercircle, Betwixt) helping GALA grow its community and user base. Nonetheless, the growing popularity of the P2P gaming sector has attracted new players in the market.
Key technical points
- The daily-RSI slope plunge above the equilibrium
- The intraday trading volume in the GALA is $1.8 Billion, indicating a 12% loss.
GALA/USD: 4-hour time frame chart
Source- Tradingview
If GALA buyers rebound from $0.3 or $.175 support, it indicates the bulls are accumulating at these levels, and the price is likely to trend higher. However, a breakout and closing above the $0.4 resistance is required for better confirmation of recovery. If bulls could sustain the above $0.4 mark, the altcoin would rise to the next target of $0.56
Gradually increasing slope of the average directional index(48) indicator suggest a strengthening of the buying power.
In our recent coverage on GALA/USD technical analysis, Coingape summarized the sudden recovery in GALA price, which doubled in just five trading days. On February 7th, the GALA coin buyers were trying to breach the shared resistance of $0.38-$0.4 and 100-day MA, but the sellers defended this level with vigor, rejecting the altcoin with a higher price rejection.

Source-tradingveiw
The daily candles show considerable wicks on the higher side from the past few days, indicating bears are selling on higher levels. If they succeed, GALA coin is expected to slide to $0.3 or $0.17.
The daily-Relative Strength index(61) surged above the neutral zone, indicating bullish sentiment among the market traders.
- Resistance levels- $0.38-$0.4 and $0.56
- Support levels- $0.3 and $0.17


