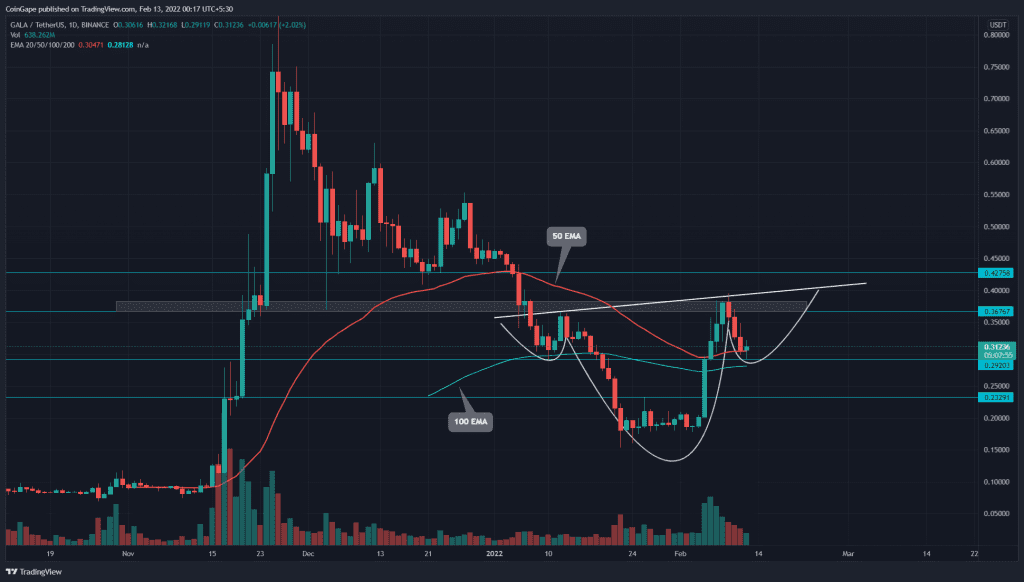
The Gala Games (GALA) price doubled during last week’s recovery rally. The buyers breached two significant resistance of $0.23 and $0.3 before reaching the monthly resistance of $0.37. The bears defended this resistance with vigor and rejected the altcoin to the immediate support of $0.3. Can buyers continue this rally or the sellers would take over again?
Key technical points:
- The 20 and 100-day EMAs offers a bullish crossover
- The intraday trading volume in the GALA is $197.7 Million, indicating a 3% gain.
Inverted Head And Shoulder Pattern Aims GALA Price To Go Beyond $0.42
Source- Tradingview
A bullish reversal from the $0.293 support could lead to the formation of an inverted head and shoulder pattern. This pattern could help the bulls to knock out the above resistance of $0.36 and $0.43, indicating a better confirmation for trend reversal.
However, the bullish assumption would be invalid if sellers pulled the GALA token below the bottom support, dropping it 20% to the $0.223 mark.
The daily chart shows a cluster of crucial EMAs(20, 50, and 100) in confluence with the $0.239 support, offering an extra edge to the long traders.
Bulls Must Breakout Of This Descending Channel

Source- Tradingview
The GALA price technical chart shows a V-Top rejection from the $0.381 resistance. This minor pullback follows a descending trendline, which discounted the coin price by 23%, bringing it to the $0.295 mark.
A few lower price rejection candles at this support indicate the buyers accumulating at this support, encouraging a bullish reversal. If bulls could pierce through the resistance trendline, Gala Games would rally to the overhead resistance of $0.38.
The downslopping 4-hour ADX indicator(24) reflects the decreasing bullish momentum. However, the indicator slope would curve up if buyers could rebound from the $0.293 support.
- Resistance level- $0.36 and $.43
- Support level-$0.293 and $0.223


