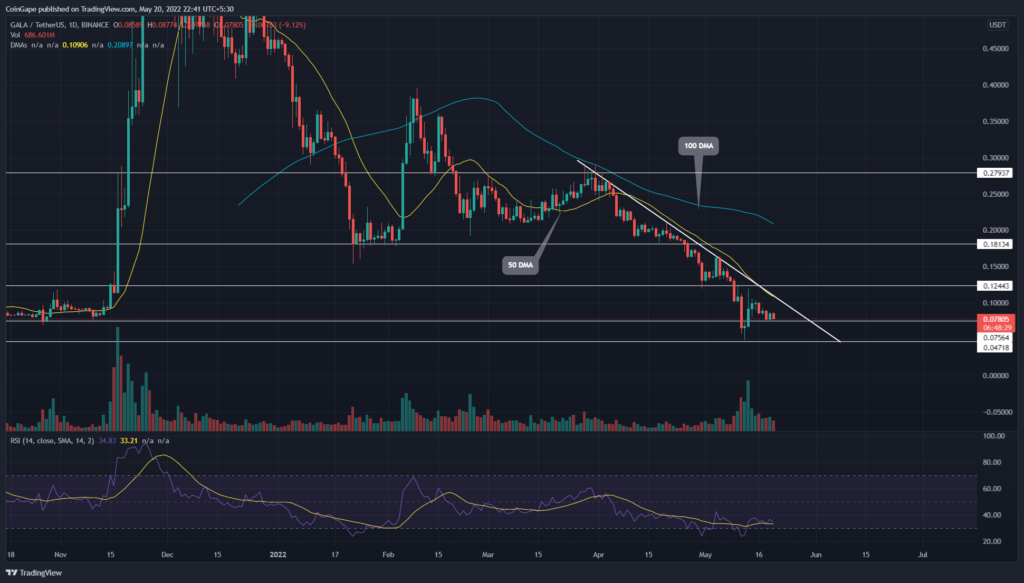
The 50 DMA aligned with a descending trendline carries a steep downward rally for the GALA price. The coin holders fell through multiple support levels and reached a low of $0.0487. However, the recent fakeout from the previous support breakdown of $0.075 has increased the buyer’s tension and may potentially kickstart a fresh bull rally.
Key points:
- GALA price tags along the 50 lpDMA offer dynamic resistance
- About 72% price drop since April 1st
- The intraday trading volume in the GALA is $359 Million indicating a 12.98% gain
Source- Tradingview
The GALA price resumed its downfall, witnessing a sharp drop since 28th March. Since the price has closely followed, the 20 DMA acts as a dynamic resistance while piercing through multiple support levels.
Moreover, the GALA price had recently breached the $0.075 support level for a moment before taking support at its current level. Over the past seven weeks, the GALA price tumbled by 72% marking its recent low at $0.0487Z’a
Trending Stories
The GALA price presently trades at $0.079, which is a crucial support zone considering the same was used as key support back in Sep ‘21 – Nov ‘21. Therefore, buyers can treat this as an excellent opportunity to kickstart a fresh rally as the same support was the initiator of the steep rally experienced in Nov ‘21.
Under a strong bullish scenario, the buyers have the potential to breach the dynamic resistance, triggering a potential recovery rally.
However, if the price slips below the $0.075 support, the bullish thesis will be invalid.
Technical Indicator
A sideways rally in the daily-RSI slope indicates the buyers are strengthening their grip over the coin concerning the declining price action. This bullish divergence may assist buyers in reclaiming the overhead resistance trendline.
However, the 50 DMA and descending trend confluence mount a troublesome hurdle for GALA buyers. Moreover, a bearish alignment among the downsloping DMAs(20, 50, 100, and 200).
- Resistance level- $0.124, and $0.181
- Support level- $0.075, and $0.047


