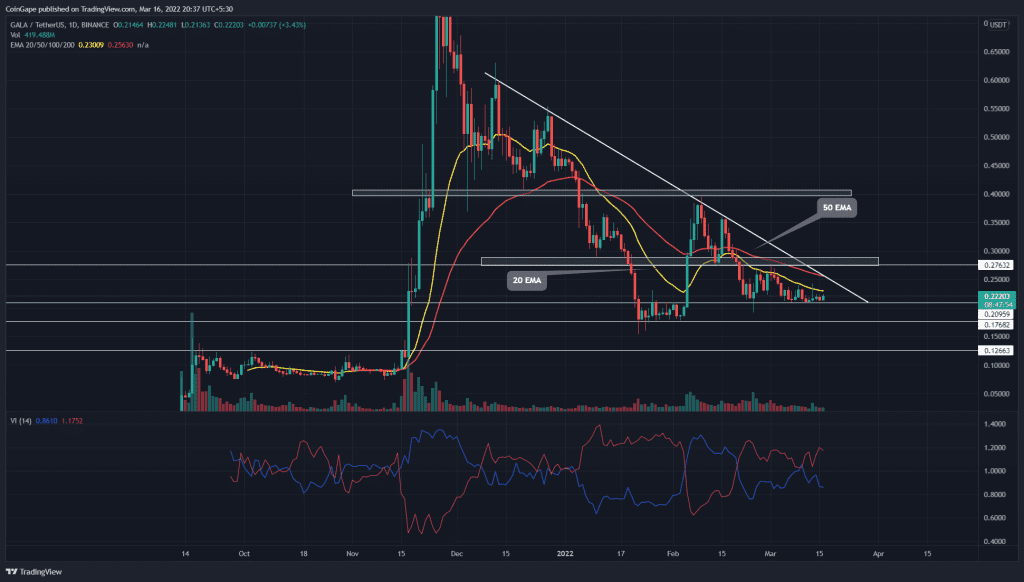
The GALA/USD pair struggles to continue the downtrend below the $0.20 support level. Furthermore, the price action hints at a descending triangle formation that may shortly result in a breakout. Will buyers manage to regain trend control, or a bearish breakdown is inevitable?
Key points:
- The GALA/USDT pair experiencing strong resistance from the 20-day EMA
- The GALA price gives multiple retests the $0.2 weekly support
- The intraday trading volume in the GALA is $641.9 Million indicating a 9.85% rise.
Source- Tradingview
The GALA price continue to create lower high formation under the bearish influence of 20-day EMA. The price action creates an illusion of a descending triangle pattern with the 20-day EMA as the resistance trendline and the support base at $0.20.
The rising trading volume along with the forming daily candle showing bullish growth teases a closing above the limiting EMA. However, the high selling pressure area moving along with the EMA will be difficult to overcome.
If buyers could surpass this high selling pressure area, the coin price would surge to the long coming resistance trendline accounting for a 7 percent growth.
However, the fallout of the demand zone at $0.20 could result in a downfall of 16% percent to the $0.175 mark.
Technical Indicator
The Volatility indicator shows the VI lines avoiding a bullish reversal crossover and sustaining the bearish spread. Hence, the possibility of a price surge above the resistance trendline increases.
The negative trend in the EMAs grows, which provides a constant resistance to keep the bullish growth in check. However, the breakout of the 20-day EMA.
- Resistance level- $0.28, and $0.36
- Support level- $0.218 and $0.178


