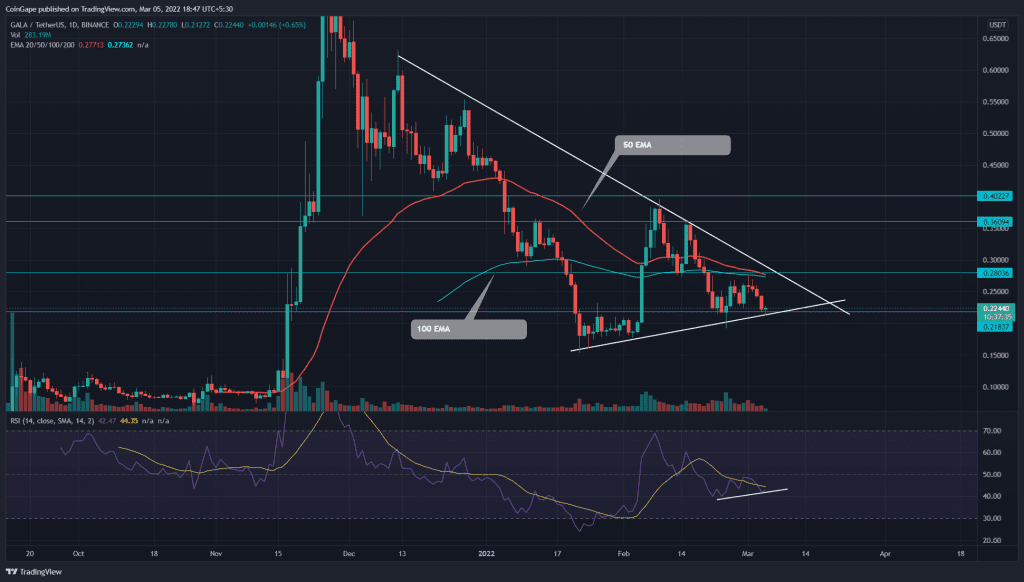
The GALA/USD pair resonates in a symmetrical triangle pattern. The altcoin retests the ascending support trendline with a daily Doji, showing indecisiveness among the traders. A bullish divergence of the RSI suggests the coin has a greater chance of bullish reversal from this support.
Key technical points:
- The GALA price falling strong resistance from the 50-and-100 EMA
- The intraday trading volume in the GALA is $671.4 Million, indicating a 19.85% loss.
Source- Tradingview
The GALA relief rally turned down from the shared resistance $0.27 and 50-day EMA on March 1st, indicating sellers are aggressively defending this level. The sellers pulled the altcoin by 22%, retesting the weekly support at $0.212.
However, the decreasing volume activity suggests weakness in the selling pressure as they approach this support. Moreover, the technical chart shows a confluence of the $0.212 and the symmetrical triangle support trendline, projecting the buyers would mount stiff support.
If buyers could rebound from these support traders, the coin price would surge 30%, reaching the overhead resistance trendline. The technical chart projects higher volume activity during the bull cycle and, in contrast, lower during the bear cycle, suggesting the traders are majorly interested in buying this coin.
If bulls could breach and sustain above the descending trendline, the traders can expect a rally to the $0.36 mark,
Technical Indicator
The Relative Strength Index(42) slope shows a bullish divergence concerning the previous swing low, suggesting a possible bullish reversal.
However, the GALA price moving below the flattish 50-and-100-day EMA states the sellers have the upper hand. Moreover, these EMAs are approaching a bearish crossover which could accelerate the selling pressure.
- Resistance level- $0.28, and $0.36
- Support level-$0.218, and $0.178


