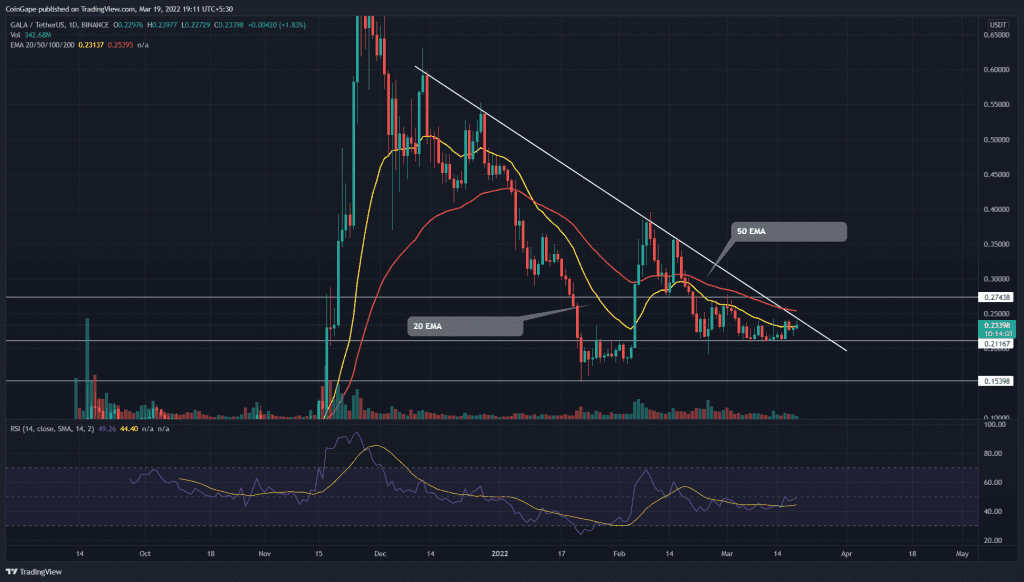
The GALA/USD pair pressurized from the descending has dropped to $0.2 support. The buyers have managed to hold the coin price above this support for a month. Can the rising bullish momentum encourage buyers to surge above the resistance trendline?
Key points:
- The GALA price gives multiple tests to the $0.2 weekly support
- The intraday trading volume in the GALA is $670.7 Million indicating a 22.81% rise.
Source- Tradingview
The GALA/USDT pair continues to display low volatility price action hovering above $0.21. For almost a month, the price has been wobbling within the $0.27-$0.21 range. The recent bounce back from the bottom support has surged the altcoin by 10.8%
The GALA price currently exchanges hands at the $0.23 mark, with an intraday gain of 2%. It may soon retest the highly influential resistance trendline, teasing for another bearish reversal. The higher price rejection attached to the daily candle hints the sellers continue to defend this level.
The possible reversal would sink the altcoin back to $0.21 support and threaten a follow-up breakdown. If they succeed, the GALA price may revisit the January low of $0.155.
Conversely, if the buyers breakout from the descending trendline and sustain above the $0.275 mark. The renewed buying pressure could pump the price to $0.36 to $0.4 mark.
Technical Indicator
The Relative Strength Index(50) indicates a neutral tendency among the traders. However, the slight inclination in the RSI slope suggests the bulls try to strengthen their grip.
The negative alignment within the 20, 50, and 100-day EMAs shares a bearish bias. A bullish breakout from the $0.27 would also engulf the 50 and 100-day EMA, giving an additional advantage to long traders.
- Resistance level- $0.27, and $0.36
- Support level- $0.21, and $0.18


