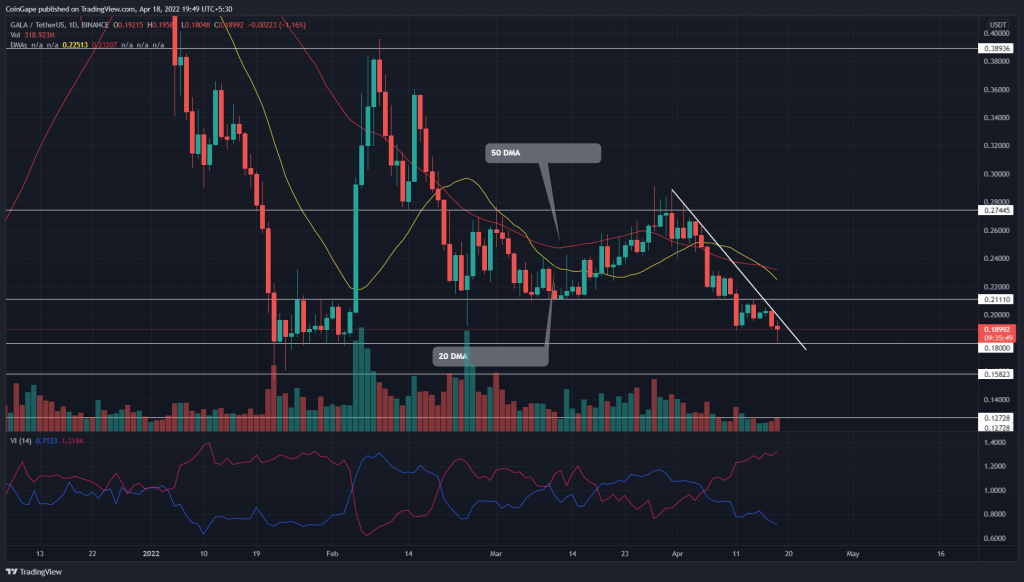
Responding to the overspread correction phase in the crypto market, the GALA price gave a bearish breakdown from the $0.21 support. The coin price retested its flipped resistance over the weekend and provided a weekly candle close below it. Furthermore, the sellers continued to lower the price and dumped it to $0.18 support.
Key points:
- The potential reversal may push the GALA price back above $0.21
- The daily candle closing below the $0.158 low would invalidate the bullish thesis
- The intraday trading volume in the GALA is $352 Million indicating a 104% gain
Source- Tradingview
Last month the GALA/USDT pair witnessed a range-bound rally between the $0.27 and $0.21 levels. On April 4th, the altcoin turned down from the overhead ceiling($0.27) and initiated a new bear cycle.
The V-top reversal undermined the March recovery rally and plunged the altcoin back to $0.21. Furthermore, the sellers continued to pressure the price and gave a decisive breakdown from the bottom support($0.21).
The post retest rally drove the price by 14%, bringing it to January’s bottom support of $0.18. A descending trendline carries this correction rally and keeps the buyer activity in control. The coin price currently trades at $0.189, with an intraday loss of 1%.
Trending Stories
A possible reversal from the bottom support would breach the overhead resistance trendline and trigger another recovery rally. The following $0.21 breakout would offer additional confirmation for buyers.
advertisement
Alternatively, a breakdown from the $0.158 support could plunge the GALA price by another 20%.
Technical Indicator
DMAs: The descending DMAs(20, 50, and 100) reflect a solid bear trend in GALA. Moreover, a bearish crossover of the 20 and 50 DMA brings additional selling in the market.
Vortex Indicator: A gradual spread between the VI+ and VI- slopes indicates a rising bearish momentum.
- Resistance level- $0.21, and $27
- Support level- $0.18, and $0.158


