XRP appeared to form a low timeframe range, while STEPN saw a strong bounce from an area of demand. However, the next day or two can be crucial for the crypto market as Bitcoin appeared to stand at a crucial juncture. PancakeSwap had a bearish leaning, but this could change if demand arrives following a shift in sentiment toward bullish.
STEPN (GMT)
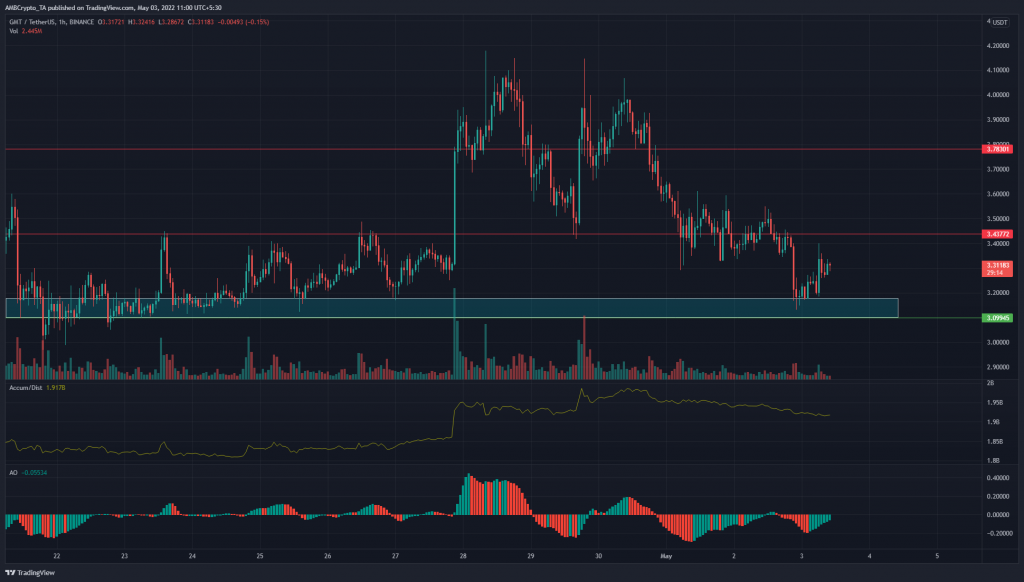
On the lower timeframes, STEPN appears to have a bearish bias to it. As the weekend approached, GMT appeared to reach a local top at $4 and pulled back around 20% to reach the $3.15 mark. The previous day’s trading saw GMT bounce from this area of demand.
The A/R line was also in a downtrend, but not steep enough to wipe out all the buying of the past two weeks. This suggested that even though the pullback was deep, GMT could rise once more provided it can find demand at the $3.1 area.
The Awesome Oscillator showed a downtrend in progress as it continued to stay below the zero line, although the green bars of the past few hours indicated a minor bounce toward the $3.4 mark.
PancakeSwap (CAKE)
PancakeSwap has an area of demand (cyan box) in the vicinity of $7.6. However, it has closed a session below this area and at press time appeared to retest it as a supply zone. Was the dip just an effect of a volatile Bitcoin, or has this zone been flipped from demand to supply?
The RSI on the 4-hour chart was below the neutral 50 line and, although momentum was neutral, it hinted at a bearish trend. No divergence was spotted yet. Meanwhile, the OBV has been setting lower highs since the beginning of April.
Therefore, further lows can be expected due to the lack of demand.
XRP
Over the past few days, XRP has traded within a range from $0.58 to $0.63. In recent hours, XRP saw a rejection at the range highs which meant that the price is likely headed back to the range lows.
The RSI on the hourly chart was at 53, to show momentum was only slightly in favor of the bulls. On the other hand, the CVD appeared to drop back beneath the zero line to denote a rise in selling pressure. Similarly, the CMF continued to say beneath -0.05 to indicate that the sellers had the upper hand in the market.


