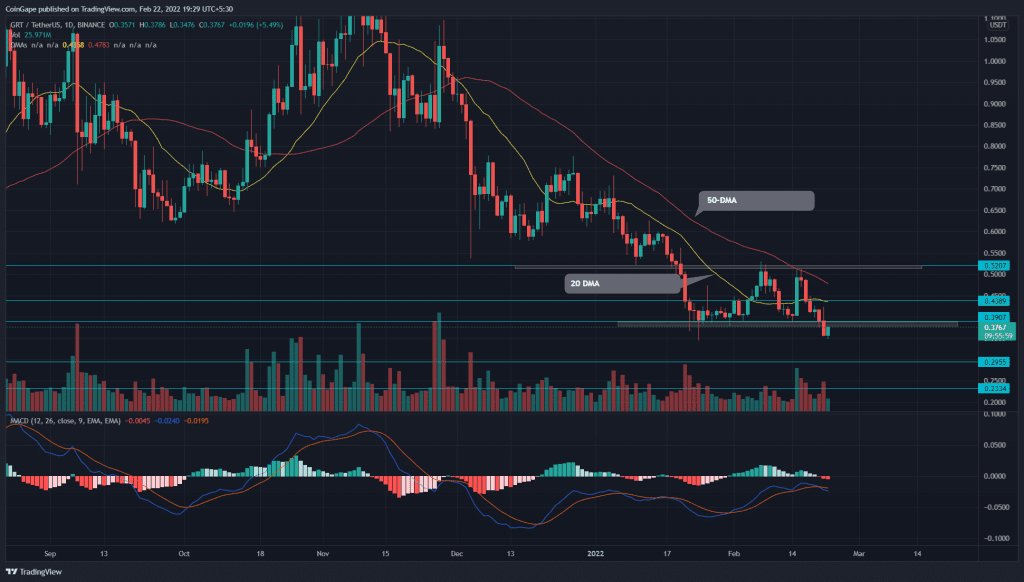
The Graph (GRT) Coin technical chart shows an overall bearish trend. Since last month, the buyers were trying to sustain above the $0.385 support giving multiple retests to this level. However, On February 21st, the sellers took the lead and breached the bottom support with a massive red candle. With today’s retest candle, the traders should resolve if sellers are ready for further fall or not.
Key technical points:
- The GRT buyers lost the 20-day SMA support
- The intraday trading volume in the GRT is $118.9 Million, indicating an 11% gain.
Source- Tradingview
On February 15th, the GRT buyers tried to breach the combined resistance of $0.52 and 50 DMA; however, the sellers did not relent and reverted the GRT coin with an evening star candle. The Renewed selling tumbled the coin by 20%, bringing it to the bottom support of $0.385.
The technical chart also revealed a double top pattern with the same neckline support mentioned above. On February 21st, the sellers gave a decisive breakdown from this support, threatening downtrend resumption.
The coin chart shows bearish alignment among the crucial DMAs(20, 50, 100, and 200), indicating the path to least resistance is downward.
The daily-MACD indicator shows a bearish crossover among the fast and slow lines below the neutral zone(0.0), indicating a sell signal for crypto traders.
Retest To New Flipped Resistance Hints A 20%Downside Risk

Source-Tradingview
The Graph (GRT) price is currently trading at the $0.37 mark with an intraday gain of 5.77%. Today’s daily green candle would retest the breached level to check for sufficient supply. If sellers sustain the pair below the $0.385 mark, the traders can expect a 20% free-fall to the $0.3 mark.
Contrary to the above assumption, if buyers push the pair above the $0.385 mark, the GRT coin would rally 15%, i.e., $0.45.
- Resistance levels- $0.385, $0.45
- Support levels are $0.3 and $0.23


