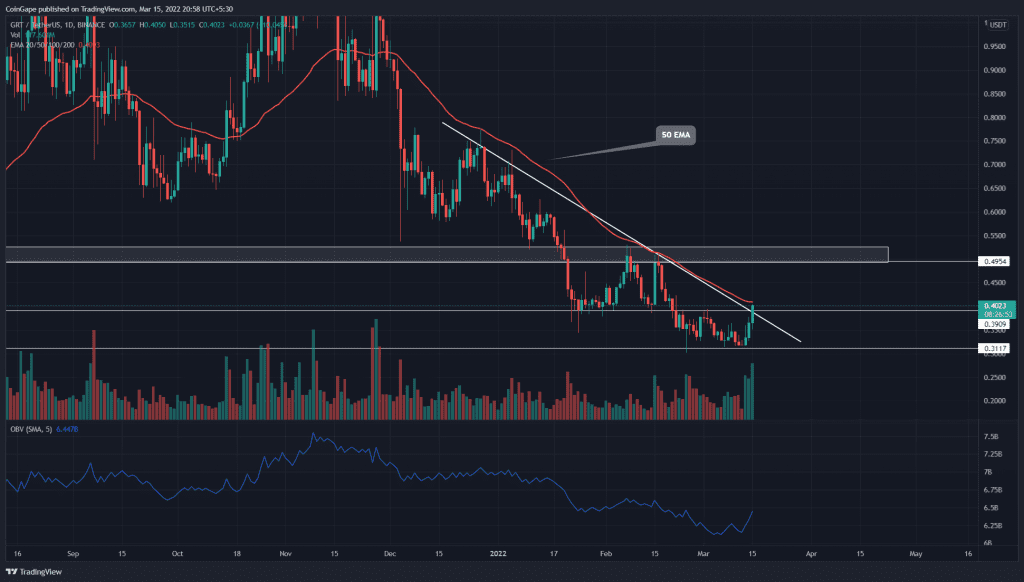
The Graph(GRT) price teases a bullish breakout from the $0.388 resistance. Escaping its consolidation phase will kick start a new recovery rally, allowing buyers to retest the $0.5 mark. However, the buyers need to overcome several technical resistances at $0.388 before they hope to reach the higher levels.
Key points:
- The GRT price breached the dynamic resistance trendline
- The intraday trading volume in the GRT is $125.6 Million, indicating a 33.6% gain.
Source- Tradingview
In the past three weeks, the GRT/USDT pair has been trapped in a tight range stretching from $0.388 and $0.317. The altcoin gave several retests to the bottom support level, indicating the traders are buying on this dip.
On March 13th, the coin price rebounded from the $0.317 level with a morning star pattern. In addition, the three consecutive daily-red candles showed high volume activity, indicating the increasing bullish momentum.
The recovery rally registered a 22.5% gain, hitting the overhead resistance of $0.388. The technical chart shows a confluence of resistance levels at this mark, such as the 50-day and descending trendline.
A breakout and closing above these combined resistances would indicate the traders’ sentiment has shifted towards buying the dip, opening the path to the $0.5 mark.
Alternatively, if sellers rejected the altcoin from the $0.39 resistance, the sideways rally might continue for a few days.
Technical chart
Today, GRT price retested the 20-day EMA suggesting the prior resistance has flipped to support. Nonetheless, the 50-day EMA reinforces the defense at $0.39 resistance, restricting buyers’ attempt to rally higher.
The rising OBV indicator slope highlights that traders’ are aggressively buying at $0.312 support. This increases the chance for bulls to break out from overhead resistance.
- Resistance levels- $0.39, AND $0.5
- Support levels are $0.317-$0.3 and $0.235


