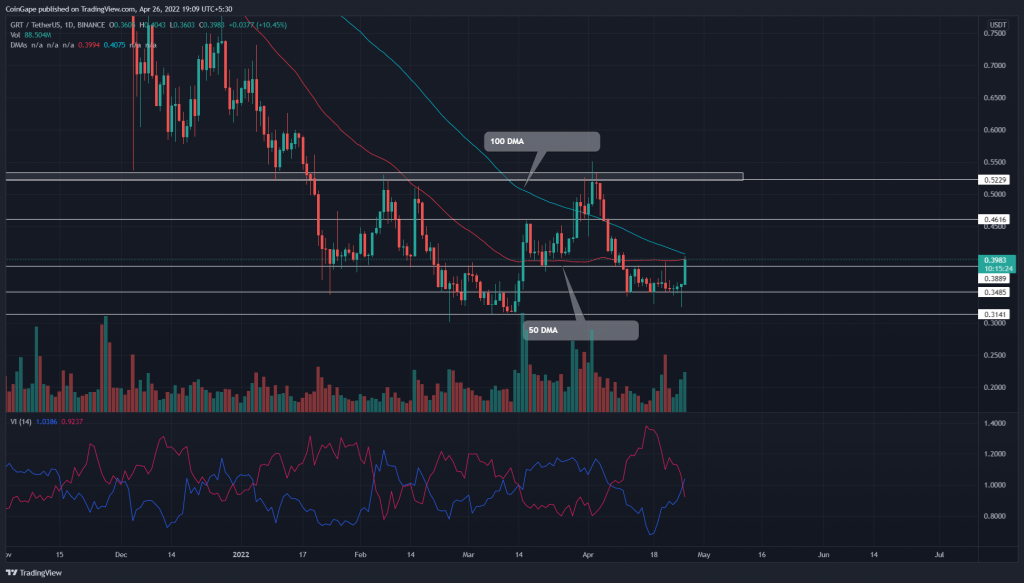
The Graph(GRT) price showcased high volatility over the past two weeks, struggling to move beyond the $0.38 or $0.34 levels. However, today, the coin price witnessed a sudden buying pressure, which gave a decisive breakout from the $0.38 mark. Sustaining through this breakout, the altcoin may retest the $0.46 or $0.53 mark.
Key points:
- Range breakout could trigger a new bull cycle in GRT
- The 50 and 100 DMA bullish breakout is on the cards
- The intraday trading volume in the GRT is $2792 Million, indicating an 88.71% gain.
Source- Tradingview
Since the January bloodbath plunged the Graph(GRT) price below the $0.52 mark, the buyers have struggled to surpass this resistance for the past three months. The recent reversal from the $0.52 mark had discounted the altcoin by 33% and brought it to the $0.35 mark.
The GRT price consolidated above this support for about two weeks, and responding to the bullish RSI divergence; it gave a massive breakout from the $0.388 resistance. The altcoin is up by 11.7% today, and the 81.3% hike in volume activity suggests a genuine breakout.
A daily-candle closing above the $0.38 resistance and 50 DMA may kickstart a new recovery rally. The post retest rally could drive the altcoin 18% higher to $0.46, followed by $0.52.
Trending Stories
Anyhow, a bullish breakout from the $0.52 resistance level is important to end this three-month-old consolidation.
Technical indicator
DMA: The unwavering flattish 50 DMA reflects a side-ways rally in GRT price. However, the 50 DMA and 100 DMA situated near the $0.4 mark put an additional barrier to the $0.388 mark.
Vortex Indicator: A bullish crossover of the V+ and V- slope gives an extra confirmation for the $0.388 breakout.
- Resistance levels- $0.38, and $0.46
- Support levels are $0.348 and $0.31


