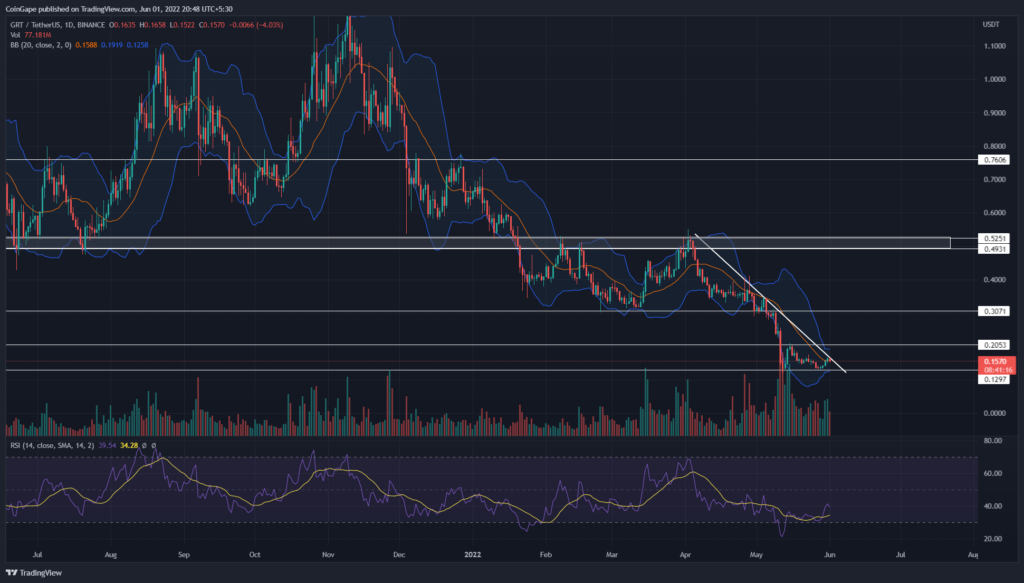
The Graph(GRT) price showcased high momentum bullish reversal starting from the $0.012 mark resulting in a trendline breakout possibility. The bullish breakout can lead to a price jump to surpass $0.20 and reach the crucial level of $0.30. However, the failure can lead to the $0.10 fallout to create a lower low formation. Will the buyers manage to surpass the resistance trendline?
advertisement
Key points:
- The GRT price has gained 20% in the past four days
- The 20 DMA offers dynamics resistance to GRT price
- The intraday trading volume in the GRT is $108.1 Million, indicating a 47% gain.
Source- Tradingview
Ever since buyers failed to break above the inverted head and shoulder neckline at $0.52, GRT prices have been under a bearish spiral. The downfall breaks under the $0.20 to take support at $0.12, destroying over 70% of the market value in under two months.
Trending Stories
The bullish support at $0.12 cushions the falling trend resulting in a lateral shift in the price trend and rechallenging the bearish trendline. Moreover, the challenge comes after the second dip at $0.12, projecting a modified double bottom reversal.
Anyhow, the reversal rally shows high chances of breakout failure as the price action shows an evening star forming with the current bearish candle. Hence, traders can expect the negative retracement can breach $0.12 and reach the psychological mark of $0.10.
On the opposite end, the unlikely trendline breakout event will lead to a bullish rally to $0.20.
Technical indicator
RSI: A bullish divergence in daily-RSI supports the possibility of descending trendline breakout. Moreover, the indicator slope has recently reclaimed the 14-SMA line and is nearing the midline.
advertisement
Bollinger band: The narrow range of Bollinger band indicators accentuates the short consolidation in price action. Thus, a breakout on either side of the indicator’s range would give an extra edge to long buyers.
- Resistance levels- $0.2, and $0.3
- Support levels are $0.13 and $0.1


