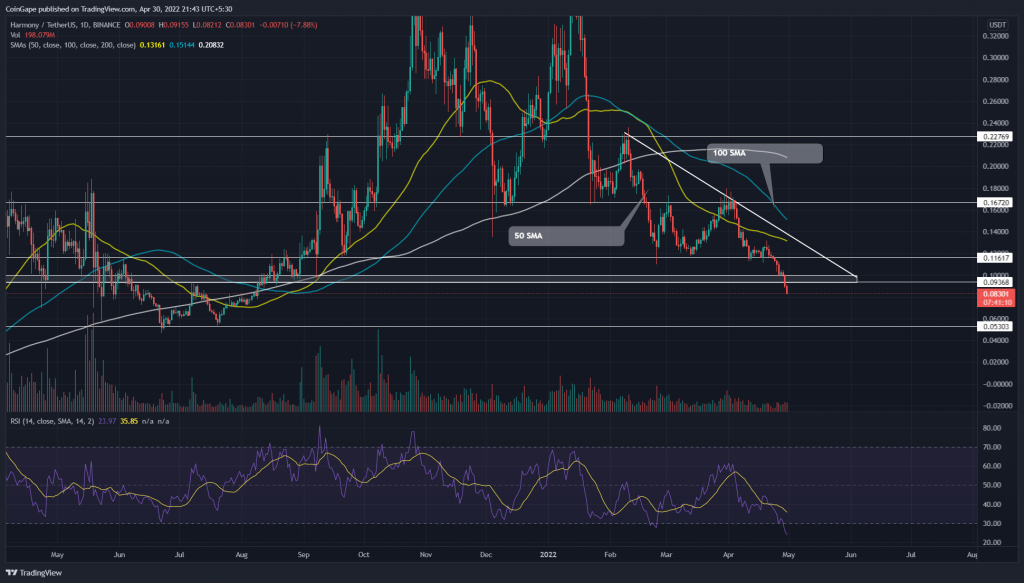
A V-Top reversal from the $0.162 resistance annihilated the entire March recovery gains by dropping the Harmony(ONE) price back to 0.116. Responding to the descending triangle pattern, the coin price breached the $0.116 neckline and reached the immediate support at $0.1. A fallout from this support suggests the selling attempt for another leg down.
Key points:
- The ONE price dropped 27.6% since last week
- The 50-and-100-day EMA offers dynamic resistance to ONE price
- The 24-hour trading volume in the Harmony coin is $73.8 Million, indicating a 24.3% gain.
Source-Tradingview
The ongoing correction phase initiated from the $0.162 resistance tumbled the Harmony(ONE) price by 50%. The bear cycle breached some significant support, such as 20-day EMA and $0.14, before hitting the $0.116 mark.
The ONE price resonated within a descending triangle for nearly three months and breached the $0.116 neckline on April 24th. The released bearish momentum made a quick strike to the neighboring crucial support of $0.1
The ONE price currently trades at $0.083, with an intraday loss of 8%. If sellers managed a sustain below the $0.1 support, the selling pressure would intensify and drive the 38% lower to the $0.053 mark.
Trending Stories
In addition, the traders are aggressively selling to bullish pullbacks on the descending resistance trendline, and therefore, traders can maintain a strong selling sentiment until this resistance is intact.
advertisement
Technical indicators:
The 50-and-100-day EMAS provides dynamic support for short and long bullish pullbacks. Moreover, the declining nature of these EMAs highlights a bear trend.
The Daily-RSI slope has fallen into the overbought region, suggesting the overextended selling from traders.
Escaping a bullish crossover, the MACD and signal lines drop lower into the bearish territory. The rising red bars on the histogram chart indicate sustained selling from the traders.
- Resistance levels: $0.1, $0.116
- Support levels: $0.72 and $0.53


