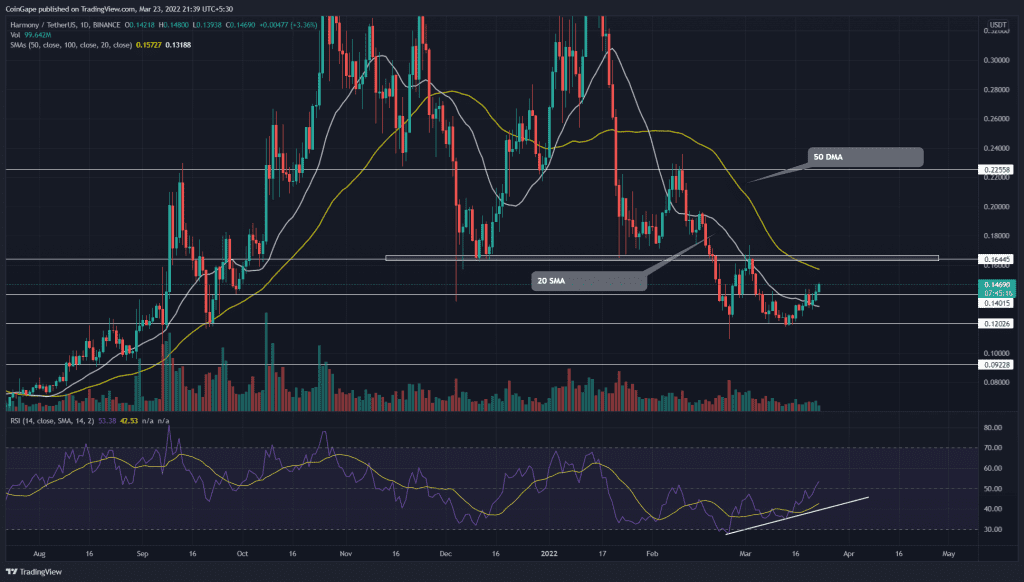
The Harmony (ONE) buyers’ recovery rally trends higher from the solid support level at $0.16. The reversal forms a double bottom pattern and hints at a bullish breakout rally. If altcoin surpasses the neckline at $0.16, it will represent a phenomenal growth in buying pressure, signaling the bullish reversal on a large scale.
Key points:
- The ONE price forming a double bottom pattern
- The 24-hour trading volume in the Harmony coin is $106.5 Million, indicating a 17.15% loss.
Source-Tradingview
In the first half of March, the dominating Harmony (ONE) sellers tumbled the coin price by 27% and plunged it to $0.12 monthly. However, the underlying demand has reverted the price higher, resulting in a 25% hike last week.
The bullish reversal forms a double bottom pattern with a neckline at $0.16. Hence, a rally is expected to the neckline at a minimum with increasing chances of a breakout as the trend gains momentum.
ONE token buyer will need to sustain above the 50-day EMA to further increase the breakout chances. However, the formidable sellers at $0.16 will be hard to overpower, as observed in the early days of March.
Therefore, a reversal from the neckline can result in the altcoin price retesting the 20-day EMA close to $0.14. In case the EMA collapses, the $0.12 horizontal level will provide active support and help in bottom creation.
The daily candlestick chart indicates that significant selling activities are observed at $0.16 and $0.225. And, on the opposite end, the demand can be expected at $0.14 and $0.12.
Technical indicators:
The recent bullish reversal breaks above the 20-day EMA and approaches the 50-day EMA. In addition, the shorter EMA shows a reversal indicating increased chances of a bullish crossover.
Concerning the last two swings low in ONE price action, the RSI slopes trend higher, displaying an evident bullish divergence. This indicates the increasing underlying bullishness in price, providing a better possibility for double bottom completion.
- Resistance levels- $22, and $30
- Support levels- $17.3 and $15


