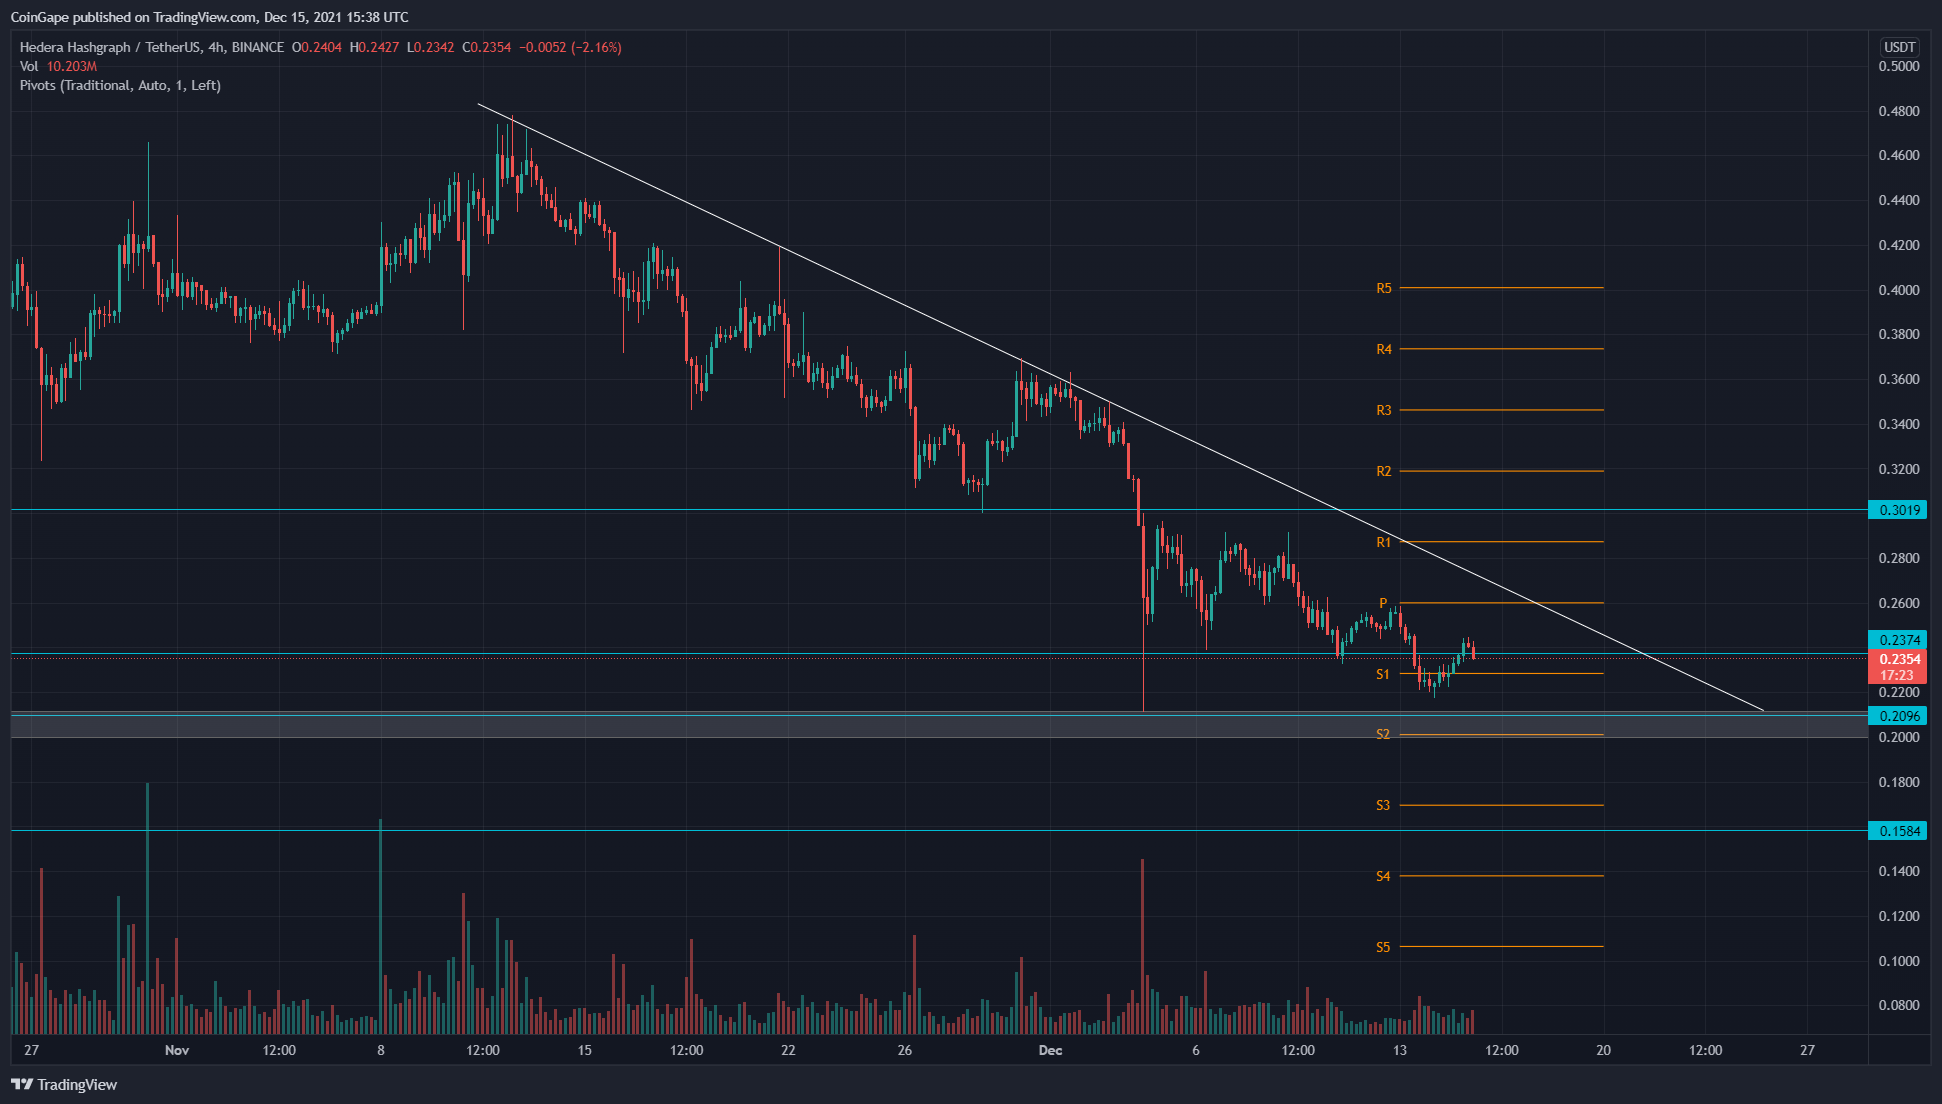
The HBAR coin is currently going through a correction phase that offers a 50% discount from its previous top of $0.473. A descending trendline is leading this retracement in the HBAR chart and could provide some great short opportunities until the line is intact
Key technical points:
- The HBAR coin price drops below the $0.237 support.
- The intraday trading volume in the HBAR coin is $56.1 Million, indicating a 15.53% loss.
Source- HBAR/USD chart by Tradingview
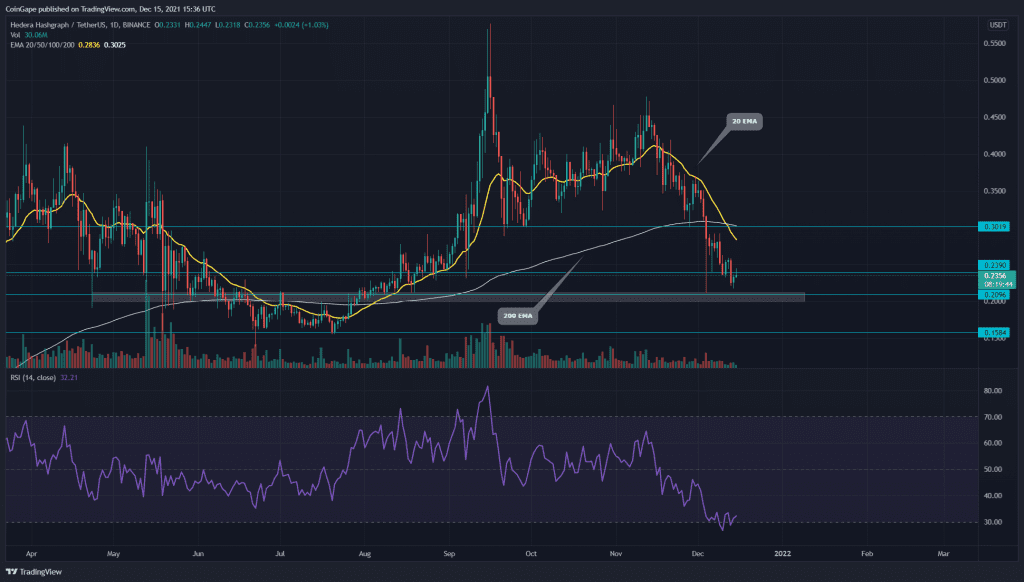
The last time when we covered an article on HBAR/USD, on November 18th, the coin price gave a decisive breakdown from a highly reliable trendline which carried a bull run from August to November. Thus, the price started moving lower, initiating a correction phase in this coin.
The coin chart showed a steady fall in its price which has recently breached another support level of $0.237. As for now, the coin has dropped 40% from the breakdown point and is currently trading at $0.234, with an intraday gain of $1.29%
The crucial EMAs (20, 50, 100, and 200) show a bearish alignment in this chart. Moreover, the 20 EMA provides dynamic resistance to the coin price. The daily Relative Strength Index (31) has indicated a significant fall in value, slowly approaching the oversold zone.
HBAR/USD 4-hour Time Frame Chart

Source- HBAR/USD chart by Tradingview
The HBAR coin is currently in a retest phase, trying to validate this new resistance of $0.237. If the price manages to sustain below this level, the coins will continue to move lower, where it will meet the next crucial support or psychological level $0.2.
However, in case of any bullish play, the crypto traders can maintain a bearish sentiment until the price doesn’t breach the resistance trendline leading to the correction phase.
As per the traditional pivot levels, the nearest resistance for the coin price is $0.26, followed by $0.286. As for the opposite end, the support levels are $0.228 and $0.2


