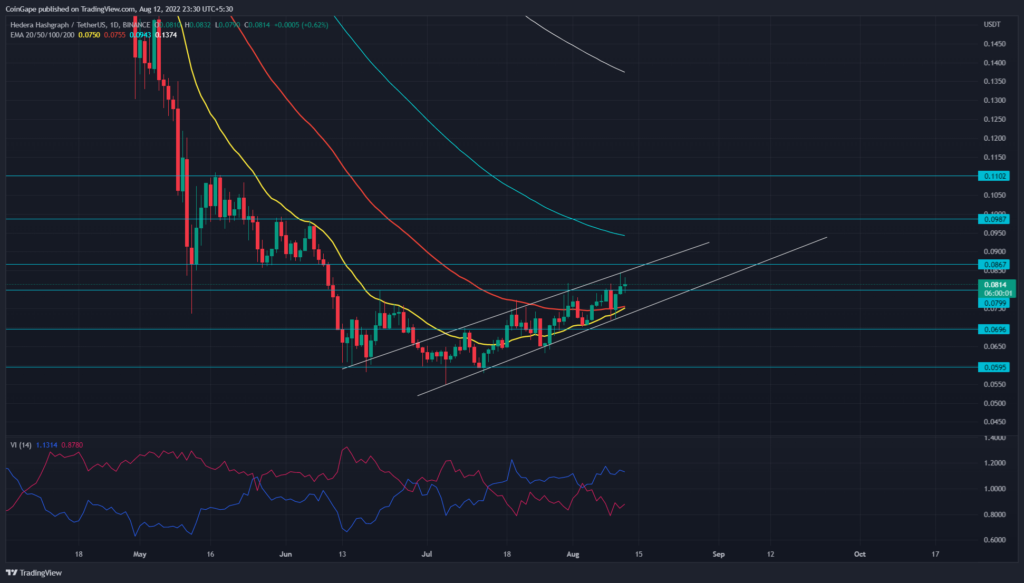
With the prolonged uptrend continuation in a rising channel, the HBAR prices skyrocket above the $0.080 mark. Furthermore, the reversal rally jumps 48% in the last five weeks resulting in the break out of the 50-day EMA. But will the uptrend break above the resistance trendline or a bear cycle leading to a retracement to the support in line is inevitable?
advertisement
Key points:
- The bullish crossover of the 20-and-50-day EMA will fuel the uptrend above the channel.
- The HBAR prices are sustaining above the 50-day EMA
- The intraday trading volume in the Hedera coin is $42.4 Million, indicating a 14.7% gain.
Source- Tradingview
With a bullish reversal from $0.059, the HBAR prices avoided a drop to the psychological mark of $0.050. The buyers overtook the trend control with a double bottom breakout with the neckline at $0.070.
However, the price action later shapeshifted into a rising channel pattern in the daily chart resulting in a bull run above the 20-and-50-day EMA. The recent bullish reversal from the pattern’s support trendline registers a 14% jump. Furthermore. the HBAR price currently trading at of $0.0824 level
Trending Stories
As prices approaches the resistance trendline, the higher price rejection becomes evident in the daily candles by long wick formations. Hence the possibility of a bear cycle continuing within the rising channel increases significantly.
Therefore in case, the market price retraces to the support trend line, traders can expect a 7.5% fall in the HBAR price.
However, in case the buying pressure breaks the resistance trendline, the unleashed bullish momentum will fuel the uptrend to reach the psychological mark of $0.10.
Technical Indicator
Vortex indicator: The Increasing bully spread between the VI lines increases the possibility of a prolonged uptrend within a rising channel pattern. Hence despite the increasing possibility of a bear cycle, traders can expect the market price to reverse from the support trend line.
advertisement
EMAs: Moreover, as the market prices since about the 50-day exponential moving average, the possibility of a bullish crossover between the 20 and 50-day EMA increases.
- Resistance level- $33.4 $43.5
Support levels- $24.1 and $21.61


