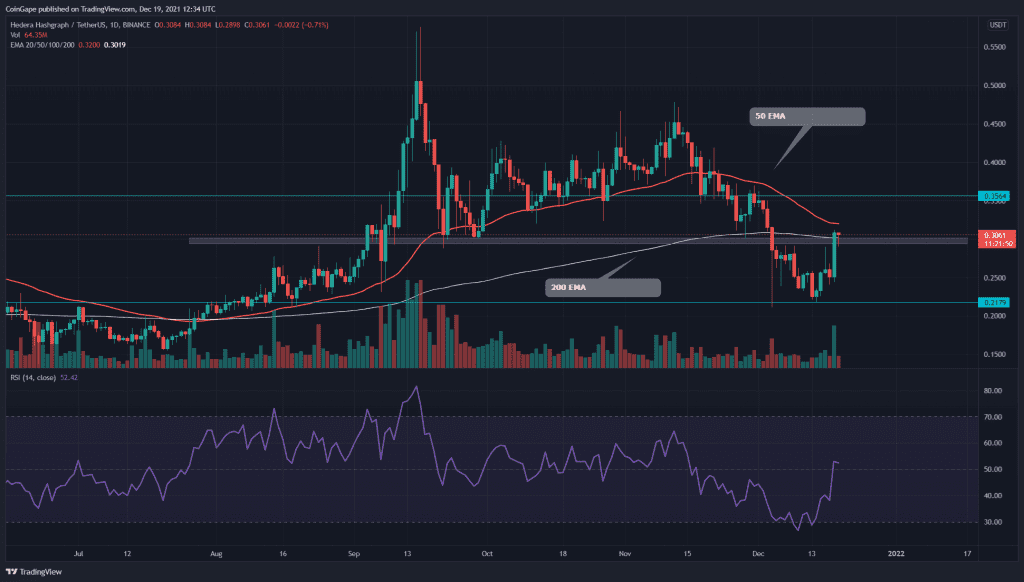
November was majorly a correction phase for the HBAR coin, which brought around a 55% discount in its value. The coin price plummeted to the $0.218 support, where it obtained sufficient demand pressure for a bullish reversal. This V-shaped price recovery is 40% up from the bottom support aiming to go beyond the $0.5 mark.
Key technical points:
- The HBAR coin price reclaims the 200-day EMA
- The daily RSI line jumps above the neutral line(50)
- The intraday trading volume in the HBAR coin is $302.4 Million, indicating a 234.5% gain.
Source- Tradingview
The last time when we covered an article on HBAR/USD, a descending trendline was leading the correction period in this coin. This pullback cost almost 55% for the long investors, plunging this price to $0.219 support.
However, on December 15th, the coin price bounced from this support level with a morning star pattern, initiating a bullish reversal. The price offered strong follow-up candles, which breached several significant resistance levels. i.e., a resistance trendline, 200-day EMA line, and a horizontal resistance zone around the $0.3.
The HBAR price has recently crossed above the daily 200 EMA, providing an excellent edge for the long traders. The daily Relative Strength Index (52) has also entered the bullish zone, supporting the ongoing rally.
HBAR/USD 4-hour Time Frame Chart

Source- Tradingview
The HBAR coin provided a strong breakout from the $0.3 resistance, with a substantial spike in trading volume. The pair is currently trying to sustain above this level, which would also provide a great entry opportunity. The coin’s current price is $0.309, with an intraday gain of 0.35.%
The technical chart suggests the nearest resistance level for the coin is $0.32, followed by $0.36. As for the flip side, the support levels are $0.3 and $0.265
The Moving average convergence divergence indicates a positive outlook with the MACD and the signal line steadily charging higher in the bullish zone.


