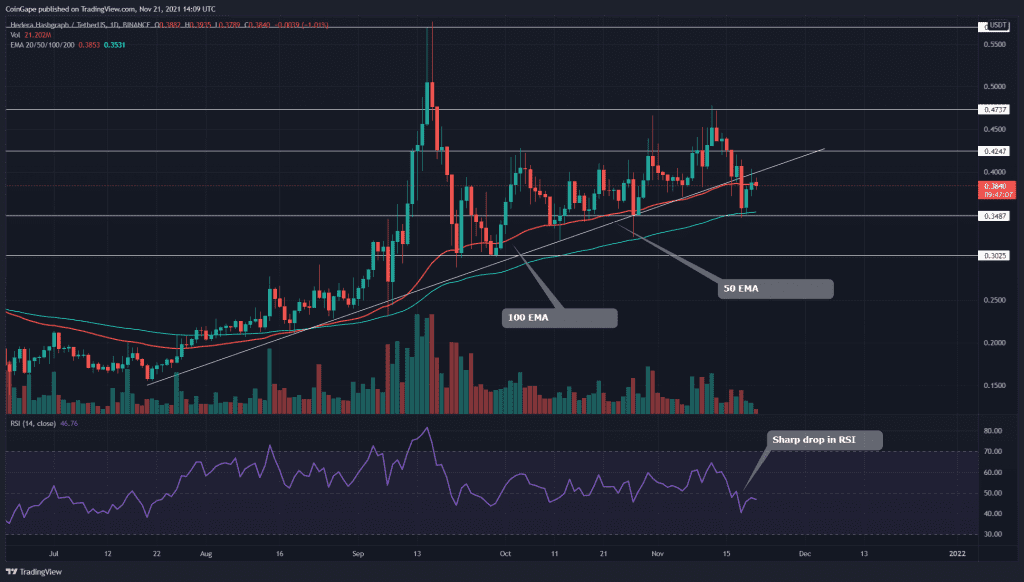
The overall trend HBAR/USD price is still bullish; however, this time, the coin could deepen its correction as the price dropped below the crucial support trendline that had been carrying the uptrend since long back. The coin still needs to go through a retest phase to validate this breakdown.
Key technical points:
- The HBAR coin’s daily RSI chart shows a striking drop in its value
- The intraday trading volume in the HBAR coin is $76.5 Million, indicating an 18% loss
Source- HBAR/USD chart by Tradingview
The HBAR coin travelled in a steady uptrend with clear higher highs and higher lows in its technical chart. This rally made an impressive recovery concerning the sudden fall of September.
Furthermore, the crypto investor can observe an ascending trendline was leading this rally, providing dynamic support to the coin. On November 18th, the HBAR price gave a decisive breakdown from the support trendline, indicating that the price would drop lower.
The Relative Strength Index(47) indicates a bearish sentiment in the coin. However, the significant drop in RSI projects the increasing strength of market sellers.
According to the crucial EMAs(20, 50, 100, and 200), the price still maintains an overall bullish trend, as its price is trading above the trend defining 100 and 200 EMA.
HBAR/USD Chart In The 4-hour Time Frame

Source- HBAR/USD chart by Tradingview
The HBAR coin price has currently retraced back to ascending trendline, with the expectation of a proper resistance from this level. This retest face will validate if the breakdown was genuine or not and confirmation for a price drop.
According to traditional pivot levels, the crypto trader can expect the nearest support level for this coin at $0.336, followed by $0.298. And on the flip side, the resistance levels are $0.388 and $0.43


