Disclaimer: The findings of the following analysis are the sole opinions of the writer and should not be considered investment advice.
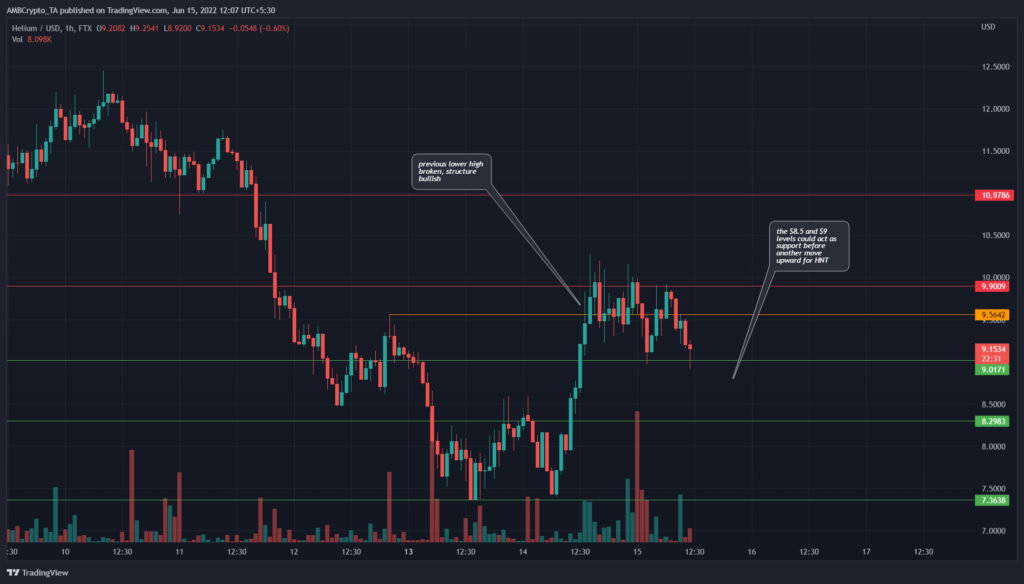
Despite the sell-off across the crypto market in the past two days, Helium [HNT] has actually made gains in the past day and a half. HNT bulls were able to hold on to the $7.36 support level and force a rally toward $9. Can the bulls keep up the pressure even as Bitcoin [BTC] bleeds?
HNT- 1 Hour Chart
The price action of the past week was bearish, but this bias flipped when the $9.56 lower high (orange) was beaten by an HNT trading session closing above this level.
Now, the short-term bias is bullish, so long as the $9 support level is defended by the bulls. In a way, there was a decision to be made in the coming hours as well. Could HNT continue to rally higher, or was this a liquidity hunt before the bears force the prices lower toward $7 again?
If the price closes a trading session beneath $8.5, the short-term bullish bias we now have will likely once more be flipped to bearish.
Rationale
The momentum indicator showed bullish momentum over the previous day on the hourly chart. The RSI has been above the neutral 50 line over the past 24 hours, which showed that the bias had been bullish.
However, it appeared to slip back beneath the neutral 50 line, and showed that bullish strength could possibly be waning. If the RSI drops below 40, it would indicate bearish strength.
At the same time, the OBV has not made spectacular gains. The OBV has been on a downtrend over the past week, and despite the previous day’s gains, demand was not enough to break above the level highlighted in red. This level was low from a couple of days ago.
Conclusion
The lack of buying pressure shown on the OBV suggests that, despite the bullish market structure break, the bears could still be in the driver’s seat. If the price drops below $8.5, it would be more likely that HNT is headed lower, toward the $7.36 support.
If Bitcoin continues to shed value, Helium could follow in its footsteps.


