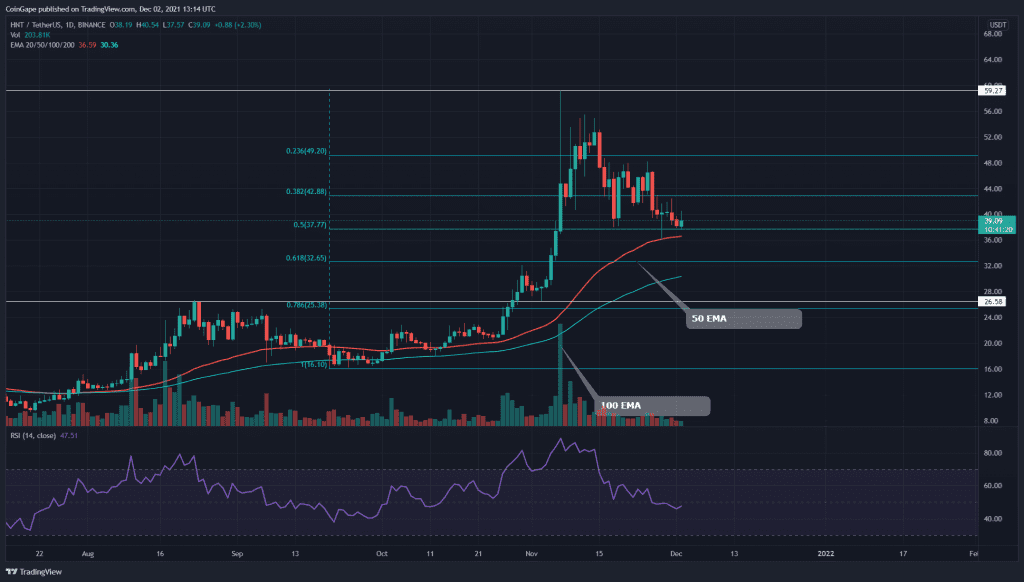
The technical chart of HNT/USD maintains an overall bullish trend in the coin. The price is currently under a usual retracement phase which has dropped to 0.5 FIb level. This chart also shows a bullish Flag pattern, indicating an excellent long opportunity when the price breaches the resistance trendline.
Key technical points:
- The HNT coin forms a Flag pattern in the 4-hour time frame chart
- The HNT daily RSI showed a striking drop in its value
- The intraday trading volume in the HNT coin is $33 Million, indicating a 16.43% hike.
Source- HNT/USD chart by Tradingview
The first half of November was strongly bullish for the HNT coin, making a New All-Time High of the $59 mark. The coin was up by 124% from the month low, and after experiencing intense selling pressure from those levels, the coin began a correction phase.
So far, this pullback has plunged the coin price to 0.5 Fibonacci retracement level, which is a 35% loss from the ATH level. Furthermore, the 50 EMA line confluence with the FIB level provides good support to the HNT price. The Relative Strength Index(47) presented a significant drop in the retracement, offering even more room for potential growth.
HNT/USD 4-hour Time Frame Chart

Source- HNT/USD chart by Tradingview
In the retracement phase of the coin, the HNT price revealed a Flag pattern in the 4-hour time frame chart. This pattern is known for a strong bullish movement when the price gives a breakout from the overhead resistance trendline.
Moreover, the traditional pivot level displays strong confluence with significant levels of the chart, as per these [ivot level, next resistance level for the coin price at $41.6, followed by $47. And on the flip side, the support levels are $34.8 and $29.4


