Published 53 mins ago
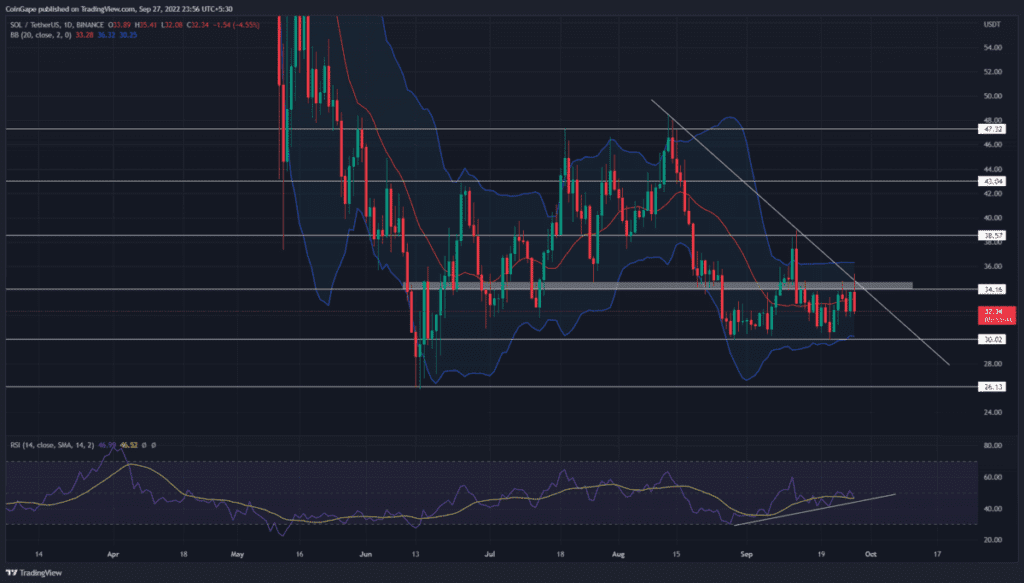
The daily technical chart shows the Solana coin price is in a short-term range-bound rally. Furthermore, this sideways is restricted within the top resistance of $47.4 and bottom support of $26. The coin holders should keep a keen eye on these levels as they will have a significant impact in the near term future.
advertisement
Key points Solana coin analysis:
- The high wick rejection candles at $34.1 validate it as a strong supply zone
- The Solana price will continue its downward spiral until the resistance trendline is intact
- The 24-hour trading volume in the Solana coin is $1.2 Billion, indicating a 42% gain

Source-Tradingview
The ongoing bear cycle within the aforementioned range has revealed a descending triangle pattern formation. In theory, this bearish continuation pattern triggers a significant boost in selling pressure once the coin price breaks below its neckline support.
Concerning this pattern, the Solana coin chart shows the $30 as the neckline support and a descending trendline as a dynamic resistance. Earlier today, the altcoin showcased a 4% gain and tried to break the $34.5 resistance.
Trending Stories
However, the descending trendline intersected at the same level, creating a strong resistance zone for buyers. Moreover, the crypto market faces sudden selling pressure and evaporates the entire intraday gains.
The Solana coin price is currently trading at the $32.84 mark, with a 3.04% loss from yesterday’s closing.
Thus, a strong rejection candle formed at $34.5 resistance indicates the coin price is likely to tumble 9% lower to hit the $30 support. Under the influence of this pattern, the SOL price should eventually break the neckline support and carry the downfall another 12.5% down to reach the June low support of $26.
On a contrary note, a possible breakout from the resistance trendline will indicate a switch in market sentiment and an opportunity for price recovery.
Technical indicator
RSI: the daily-RSI slope shows an evident bullish divergence concerning the price restest to the $30 support. This divergence strengthens the possibility of a bullish recovery.
advertisement
Bollinger band indicator: the coin price nosedive below the indicator midline indicates the sellers will remain in charge of price behavior.
- Resistance level- $34.5 and $38.5
- Support levels- $30 and $26
Share this article on:
The presented content may include the personal opinion of the author and is subject to market condition. Do your market research before investing in cryptocurrencies. The author or the publication does not hold any responsibility for your personal financial loss.


